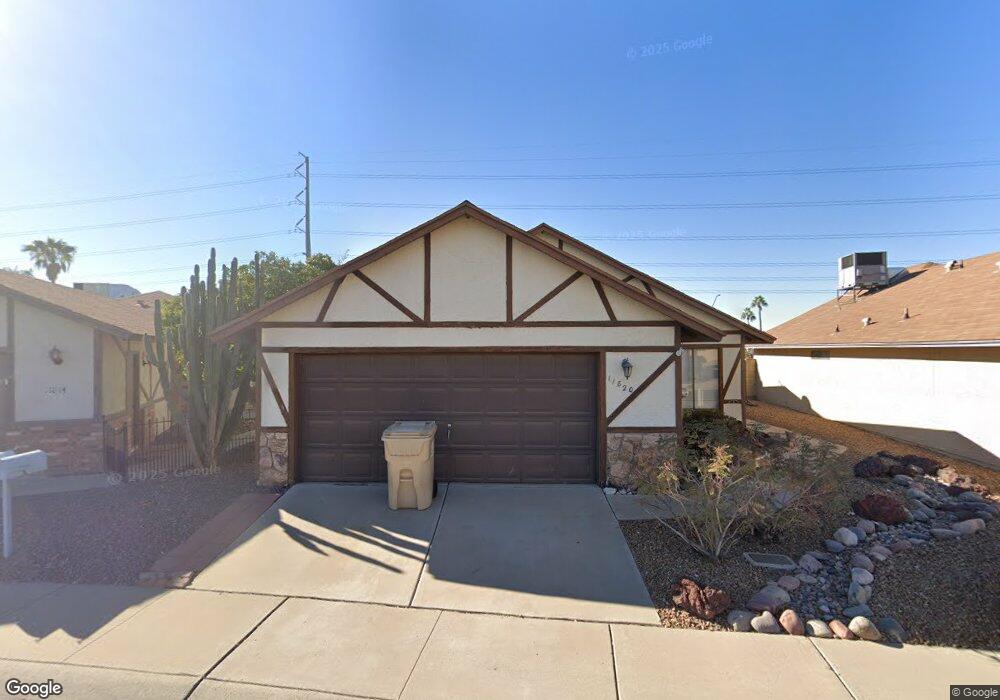
11820 N 66th Dr Glendale, AZ 85304
Estimated Value: $298,729 - $359,000
--
Bed
2
Baths
1,603
Sq Ft
$212/Sq Ft
Est. Value
About This Home
This home is located at 11820 N 66th Dr, Glendale, AZ 85304 and is currently estimated at $339,182, approximately $211 per square foot. 11820 N 66th Dr is a home located in Maricopa County with nearby schools including Desert Valley Elementary School, Ironwood High School, and Legacy Traditional School - Glendale.
Ownership History
Date
Name
Owned For
Owner Type
Purchase Details
Closed on
Aug 24, 2004
Sold by
Graser Michael A and Graser Isolde
Bought by
Graser Marc
Current Estimated Value
Home Financials for this Owner
Home Financials are based on the most recent Mortgage that was taken out on this home.
Original Mortgage
$108,300
Outstanding Balance
$53,526
Interest Rate
5.95%
Mortgage Type
FHA
Estimated Equity
$285,656
Purchase Details
Closed on
Aug 25, 1999
Sold by
Stopp Dale A and Stopp Rose M
Bought by
Graser Michael A and Graser Isolde
Home Financials for this Owner
Home Financials are based on the most recent Mortgage that was taken out on this home.
Original Mortgage
$100,845
Interest Rate
7.76%
Mortgage Type
VA
Purchase Details
Closed on
Jun 29, 1994
Sold by
Robinson Charlene
Bought by
Stopp Dale A and Stopp Rose M
Create a Home Valuation Report for This Property
The Home Valuation Report is an in-depth analysis detailing your home's value as well as a comparison with similar homes in the area
Home Values in the Area
Average Home Value in this Area
Purchase History
| Date | Buyer | Sale Price | Title Company |
|---|---|---|---|
| Graser Marc | $110,000 | First American Title Ins Co | |
| Graser Michael A | $101,000 | Chicago Title Insurance Co | |
| Stopp Dale A | $86,500 | First Southwestern Title |
Source: Public Records
Mortgage History
| Date | Status | Borrower | Loan Amount |
|---|---|---|---|
| Open | Graser Marc | $108,300 | |
| Previous Owner | Graser Michael A | $100,845 |
Source: Public Records
Tax History Compared to Growth
Tax History
| Year | Tax Paid | Tax Assessment Tax Assessment Total Assessment is a certain percentage of the fair market value that is determined by local assessors to be the total taxable value of land and additions on the property. | Land | Improvement |
|---|---|---|---|---|
| 2025 | $810 | $10,630 | -- | -- |
| 2024 | $827 | $10,124 | -- | -- |
| 2023 | $827 | $24,880 | $4,970 | $19,910 |
| 2022 | $819 | $18,860 | $3,770 | $15,090 |
| 2021 | $879 | $17,200 | $3,440 | $13,760 |
| 2020 | $893 | $16,000 | $3,200 | $12,800 |
| 2019 | $868 | $14,410 | $2,880 | $11,530 |
| 2018 | $847 | $13,020 | $2,600 | $10,420 |
| 2017 | $853 | $11,780 | $2,350 | $9,430 |
| 2016 | $848 | $11,700 | $2,340 | $9,360 |
| 2015 | $795 | $11,850 | $2,370 | $9,480 |
Source: Public Records
Map
Nearby Homes
- 6821 W Cherry Hills Dr
- 6739 W Cactus Rd
- 6763 W Wethersfield Rd
- 6746 W Wethersfield Rd
- 6849 W Wethersfield Rd
- 6749 W Charter Oak Rd
- 6409 W Poinsettia Dr
- 6409 W Riviera Dr
- 6845 W Charter Oak Rd
- 6914 W Sunnyside Dr Unit 3
- 6527 W Bloomfield Rd
- 6938 W Jenan Dr
- 6210 W Desert Hills Dr
- 7044 W Cameron Dr
- 7113 W Sunnyside Dr
- 6131 W Desert Hills Dr
- 7126 W Jenan Dr
- 10960 N 67th Ave Unit 118
- 10960 N 67th Ave Unit 235
- 10960 N 67th Ave Unit 105
- 11826 N 66th Dr
- 11814 N 66th Dr
- 11802 N 67th Ave
- 6641 W Poinsettia Dr Unit 4
- 6630 W Poinsettia Dr
- 6637 W Poinsettia Dr
- 6626 W Poinsettia Dr
- 6633 W Poinsettia Dr
- 6625 W Laurel Ave
- 6703 W Cherry Hills Dr
- 6629 W Laurel Ave
- 6646 W Sunnyside Dr
- 6702 W Sunnyside Dr
- 6622 W Poinsettia Dr
- 6640 W Sunnyside Dr Unit SHARP
- 6640 W Sunnyside Dr
- 6629 W Poinsettia Dr
- 6621 W Laurel Ave
- 6634 W Sunnyside Dr
- 6617 W Laurel Ave