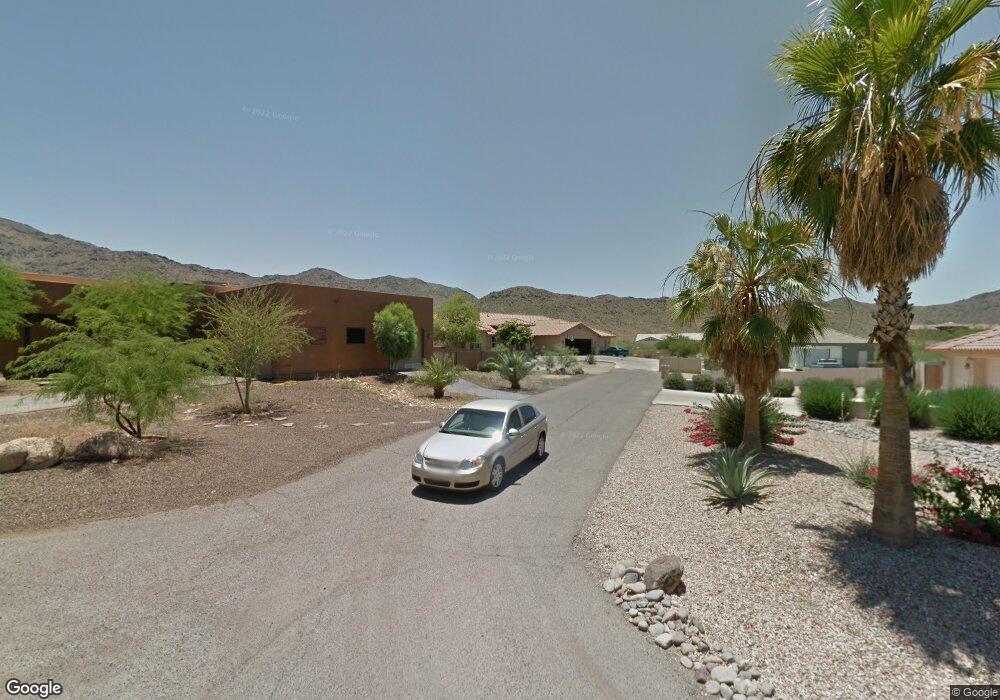
11823 S 42nd Dr Laveen, AZ 85339
Laveen NeighborhoodEstimated Value: $778,091 - $937,000
4
Beds
3
Baths
3,143
Sq Ft
$281/Sq Ft
Est. Value
About This Home
This home is located at 11823 S 42nd Dr, Laveen, AZ 85339 and is currently estimated at $884,023, approximately $281 per square foot. 11823 S 42nd Dr is a home located in Maricopa County with nearby schools including Cesar Chavez High School and Phoenix Coding Academy.
Ownership History
Date
Name
Owned For
Owner Type
Purchase Details
Closed on
Sep 8, 2025
Sold by
Wordwide Properties Llc
Bought by
Social Houses Llc
Current Estimated Value
Purchase Details
Closed on
Apr 12, 2022
Sold by
Quality Houses Llc
Bought by
Wordwide Properties Llc
Purchase Details
Closed on
Sep 19, 2018
Sold by
Diaz Cristina
Bought by
Quality Houses Llc
Purchase Details
Closed on
Aug 25, 2017
Sold by
Casas Y Howes Llc
Bought by
Social Houses Llc and Diaz Cristina
Purchase Details
Closed on
Apr 6, 2004
Sold by
Degranillo Fernando
Bought by
Degranillo Luz Elena Mendivil and Granillo Luz Mendivil
Home Financials for this Owner
Home Financials are based on the most recent Mortgage that was taken out on this home.
Original Mortgage
$333,000
Interest Rate
7.25%
Mortgage Type
Purchase Money Mortgage
Create a Home Valuation Report for This Property
The Home Valuation Report is an in-depth analysis detailing your home's value as well as a comparison with similar homes in the area
Home Values in the Area
Average Home Value in this Area
Purchase History
| Date | Buyer | Sale Price | Title Company |
|---|---|---|---|
| Social Houses Llc | -- | None Listed On Document | |
| Wordwide Properties Llc | -- | None Listed On Document | |
| Quality Houses Llc | -- | None Available | |
| Social Houses Llc | -- | None Available | |
| Degranillo Luz Elena Mendivil | -- | Stewart Title & Trust | |
| Degranillo Luz Elena Mendivil | $370,000 | Stewart Title & Trust |
Source: Public Records
Mortgage History
| Date | Status | Borrower | Loan Amount |
|---|---|---|---|
| Previous Owner | Degranillo Luz Elena Mendivil | $333,000 |
Source: Public Records
Tax History Compared to Growth
Tax History
| Year | Tax Paid | Tax Assessment Tax Assessment Total Assessment is a certain percentage of the fair market value that is determined by local assessors to be the total taxable value of land and additions on the property. | Land | Improvement |
|---|---|---|---|---|
| 2025 | $6,163 | $39,942 | -- | -- |
| 2024 | $6,050 | $38,040 | -- | -- |
| 2023 | $6,050 | $61,920 | $12,380 | $49,540 |
| 2022 | $5,899 | $47,230 | $9,440 | $37,790 |
| 2021 | $5,957 | $45,460 | $9,090 | $36,370 |
| 2020 | $5,790 | $44,110 | $8,820 | $35,290 |
| 2019 | $5,820 | $41,060 | $8,210 | $32,850 |
| 2018 | $5,625 | $36,680 | $7,330 | $29,350 |
| 2017 | $5,345 | $35,600 | $7,120 | $28,480 |
| 2016 | $5,098 | $34,750 | $6,950 | $27,800 |
| 2015 | $4,741 | $34,700 | $6,940 | $27,760 |
Source: Public Records
Map
Nearby Homes
- 4304 W Cll Poco
- 3939 W Fox Rd
- 4019 W Gumina Ave W Unit 15
- 3923 W Fox Rd
- 0 W Kayenta Trail Unit 6779097
- 4427 W Cll Poco
- 11715 S 39th Ave
- 3835 W Fox Rd
- 11404 S 38th Ave
- 4313 W Ceton Dr
- 11522 S 36th Ave
- XXXXX W Carver & S 37th Ave
- 10400 S 41st Ave Unit 4
- 4005 W Sunrise Dr Unit 5
- 4004 W Sunrise Dr Unit 4
- 4003 W Sunrise Dr Unit 3
- 4423 W Lodge Dr
- Agate Plan at Laveen Vistas - Seasons
- Emerald Plan at Laveen Vistas - Seasons
- Harley Plan at Laveen Vistas - Seasons
- 11817 S 42nd Dr
- 4131 W Calle Poco
- 4212 W Gumina Ave
- 4228 W Gumina Ave
- 11829 S 43rd Ave
- 4136 W Gumina Ave
- 11808 S 42nd Dr
- 4123 W Calle Poco
- 11706 S 42nd Ave
- 11835 S 43rd Ave
- 39xx W Gumina Lot 16q Dr15 Dr Unit 15
- 11709 S 42nd Ave
- 11639 S 43rd Ave
- 4115 W Calle Poco
- 4303 W Calle Poco
- 11908 S 41st Ave
- 121xx S 43rd Ave Unit 14
- 121xx S 43rd Ave Unit 12
- 11810 S 43rd Ave
- 11629 S 43rd Ave