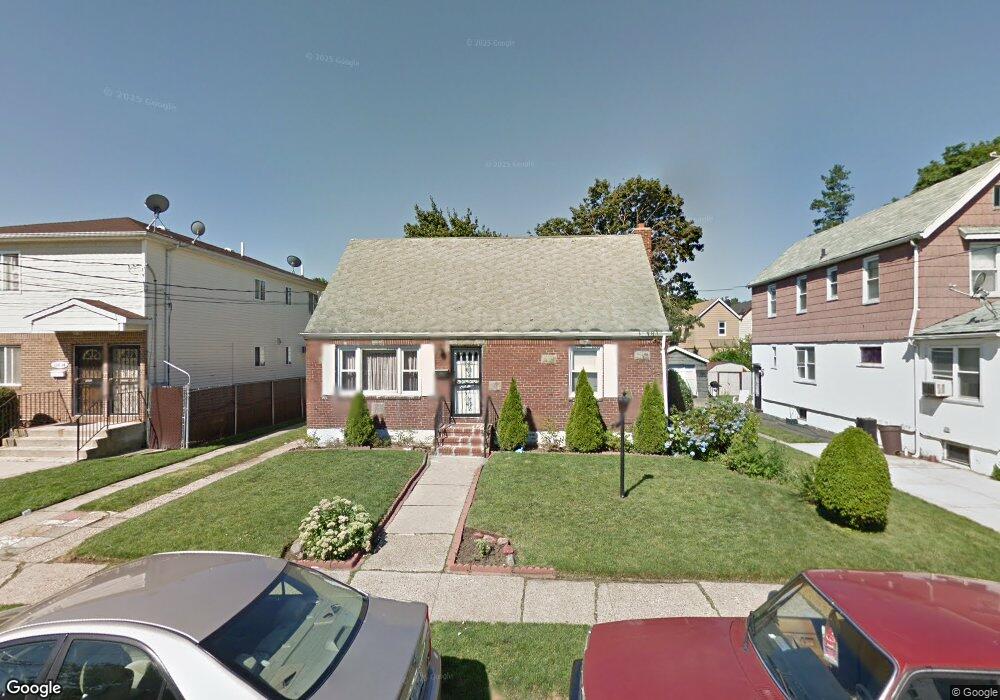
11828 204th St Saint Albans, NY 11412
Saint Albans NeighborhoodEstimated Value: $642,994 - $893,000
4
Beds
3
Baths
1,138
Sq Ft
$668/Sq Ft
Est. Value
About This Home
This home is located at 11828 204th St, Saint Albans, NY 11412 and is currently estimated at $760,749, approximately $668 per square foot. 11828 204th St is a home located in Queens County with nearby schools including P.S. 136 Roy Wilkins, I.S. 192 The Linden, and Success Academy Springfield Gardens.
Ownership History
Date
Name
Owned For
Owner Type
Purchase Details
Closed on
Aug 30, 2018
Sold by
Lee Curtis T
Bought by
Lee Tracy V
Current Estimated Value
Purchase Details
Closed on
May 28, 2002
Sold by
Rome Corp
Bought by
Lee Curtis T
Home Financials for this Owner
Home Financials are based on the most recent Mortgage that was taken out on this home.
Original Mortgage
$295,365
Interest Rate
6.92%
Purchase Details
Closed on
Jan 24, 2002
Sold by
Earle Robert M
Bought by
Rome Corp
Purchase Details
Closed on
Jan 13, 1994
Sold by
Earle Marlane
Bought by
Bonaparte Susie
Purchase Details
Closed on
Jan 14, 1993
Sold by
Bonaparte Susie
Bought by
Earle Marlane D and Earle Robert Maurice
Create a Home Valuation Report for This Property
The Home Valuation Report is an in-depth analysis detailing your home's value as well as a comparison with similar homes in the area
Home Values in the Area
Average Home Value in this Area
Purchase History
| Date | Buyer | Sale Price | Title Company |
|---|---|---|---|
| Lee Tracy V | -- | -- | |
| Lee Tracy V | -- | -- | |
| Lee Curtis T | -- | -- | |
| Lee Curtis T | -- | -- | |
| Rome Corp | -- | -- | |
| Rome Corp | -- | -- | |
| Bonaparte Susie | -- | Commonwealth Land Title Ins | |
| Bonaparte Susie | -- | Commonwealth Land Title Ins | |
| Earle Marlane D | -- | First American Title Ins Co | |
| Earle Marlane D | -- | First American Title Ins Co |
Source: Public Records
Mortgage History
| Date | Status | Borrower | Loan Amount |
|---|---|---|---|
| Previous Owner | Lee Curtis T | $295,365 |
Source: Public Records
Tax History Compared to Growth
Tax History
| Year | Tax Paid | Tax Assessment Tax Assessment Total Assessment is a certain percentage of the fair market value that is determined by local assessors to be the total taxable value of land and additions on the property. | Land | Improvement |
|---|---|---|---|---|
| 2025 | $6,780 | $35,783 | $14,582 | $21,201 |
| 2024 | $6,780 | $33,758 | $14,353 | $19,405 |
| 2023 | $6,397 | $31,849 | $13,227 | $18,622 |
| 2022 | $6,358 | $42,240 | $18,240 | $24,000 |
| 2021 | $6,652 | $39,720 | $18,240 | $21,480 |
| 2020 | $6,312 | $34,380 | $18,240 | $16,140 |
| 2019 | $5,885 | $29,460 | $18,240 | $11,220 |
| 2018 | $5,410 | $26,541 | $16,950 | $9,591 |
| 2017 | $5,410 | $26,541 | $15,697 | $10,844 |
| 2016 | $5,265 | $26,541 | $15,697 | $10,844 |
| 2015 | $3,020 | $24,849 | $14,526 | $10,323 |
| 2014 | $3,020 | $23,444 | $13,474 | $9,970 |
Source: Public Records
Map
Nearby Homes
- 118-15 203rd St
- 118-28 204th St
- 117-31 202nd St
- 118 ave 202 St
- 117-28 202nd St
- 118-55 204th St
- 11839 205th St
- 117-02 202nd St
- 11812 Francis Lewis Blvd
- 116-40 203rd St
- 118-27 201st St
- 116-30 205th St
- 205-26 116th Rd
- 200-19 119th Ave
- 11927 Springfield Blvd
- 120-06 Springfield Blvd
- 118-32 200th St
- 115-69 203rd St
- 20516 115th Dr
- 218-11 119th Ave
- 11828 204th St
- 11824 204th St
- 11834 204th St
- 11822 204th St
- 11836 204th St
- 11820 204th St
- 11816 204th St
- 11827 203rd St
- 11831 203rd St
- 11823 203rd St
- 11827 204th St
- 11814 204th St
- 11821 203rd St
- 11840 204th St
- 118-29 204th St
- 11814 204th St
- 118-23 204th St
- 11823 203rd St
- 11835 203rd St
- 11829 204th St