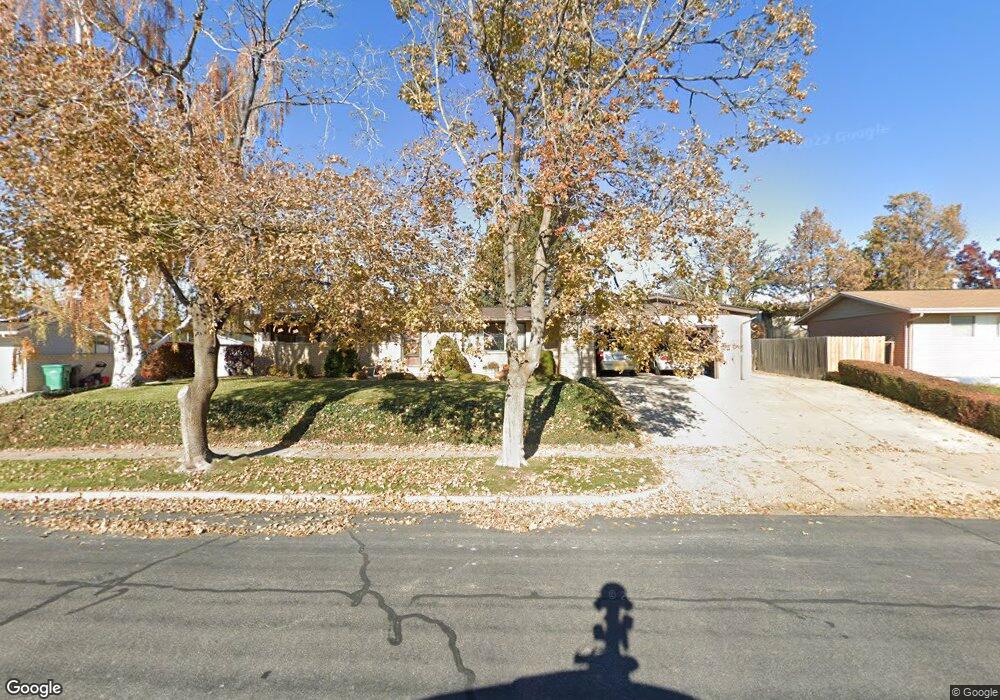
1183 E 1100 S Clearfield, UT 84015
Estimated Value: $438,000 - $476,000
5
Beds
3
Baths
2,884
Sq Ft
$160/Sq Ft
Est. Value
About This Home
This home is located at 1183 E 1100 S, Clearfield, UT 84015 and is currently estimated at $462,652, approximately $160 per square foot. 1183 E 1100 S is a home located in Davis County with nearby schools including South Clearfield Elementary School, North Davis Junior High School, and Clearfield High School.
Ownership History
Date
Name
Owned For
Owner Type
Purchase Details
Closed on
Apr 11, 2022
Sold by
Curtis Jones Roger and Curtis Clara J
Bought by
Roger And Clara Jones Living Trust
Current Estimated Value
Purchase Details
Closed on
Jul 14, 2009
Sold by
Jones Roger Curtis and Jones Clara J
Bought by
Jones Roger C and Jones Clara J
Home Financials for this Owner
Home Financials are based on the most recent Mortgage that was taken out on this home.
Original Mortgage
$125,100
Interest Rate
4.73%
Mortgage Type
New Conventional
Purchase Details
Closed on
Sep 24, 1998
Sold by
Jones Roger Curtis
Bought by
Jones Roger Curtis and Jones Clara J
Home Financials for this Owner
Home Financials are based on the most recent Mortgage that was taken out on this home.
Original Mortgage
$141,213
Interest Rate
6.88%
Mortgage Type
VA
Purchase Details
Closed on
Mar 3, 1997
Sold by
Ray William M and Ray Helen A
Bought by
Ray Helen A and Ray William M
Create a Home Valuation Report for This Property
The Home Valuation Report is an in-depth analysis detailing your home's value as well as a comparison with similar homes in the area
Home Values in the Area
Average Home Value in this Area
Purchase History
| Date | Buyer | Sale Price | Title Company |
|---|---|---|---|
| Roger And Clara Jones Living Trust | -- | None Listed On Document | |
| Jones Roger C | -- | Bonneville Superior Tit | |
| Jones Roger Curtis | -- | Equity Title Agency | |
| Jones Roger Curtis | -- | Equity Title Agency | |
| Ray Helen A | -- | -- |
Source: Public Records
Mortgage History
| Date | Status | Borrower | Loan Amount |
|---|---|---|---|
| Previous Owner | Jones Roger C | $125,100 | |
| Previous Owner | Jones Roger Curtis | $141,213 |
Source: Public Records
Tax History
| Year | Tax Paid | Tax Assessment Tax Assessment Total Assessment is a certain percentage of the fair market value that is determined by local assessors to be the total taxable value of land and additions on the property. | Land | Improvement |
|---|---|---|---|---|
| 2025 | $2,762 | $247,500 | $83,741 | $163,759 |
| 2024 | $2,663 | $240,350 | $79,972 | $160,378 |
| 2023 | $2,408 | $399,000 | $126,761 | $272,239 |
| 2022 | $2,516 | $225,500 | $71,548 | $153,952 |
| 2021 | $2,282 | $309,000 | $82,249 | $226,751 |
| 2020 | $2,008 | $270,000 | $70,394 | $199,606 |
| 2019 | $1,951 | $259,000 | $69,355 | $189,645 |
| 2018 | $1,794 | $232,000 | $58,482 | $173,518 |
| 2016 | $1,595 | $107,855 | $25,010 | $82,845 |
| 2015 | $1,574 | $101,475 | $25,010 | $76,465 |
| 2014 | $1,466 | $95,781 | $25,010 | $70,771 |
| 2013 | -- | $92,951 | $32,830 | $60,121 |
Source: Public Records
Map
Nearby Homes
- 1127 E 1050 S
- 1612 E 925 S
- 897 E 1000 S
- 1543 E 750 S Unit C5
- 846 S 1625 E Unit C
- 732 E 1000 S
- 1644 E 700 S
- 564 S 800 E
- 908 S 550 E
- 1916 N Celia Way
- 1870 N Celia Way
- 2931 N 1175 W
- 2896 N 1175 W
- 2893 N 1150 W
- 875 S Depot St Unit C307
- 875 S Depot St Unit A335
- 875 S Depot St Unit C301
- 875 S Depot St Unit B355
- 875 S Depot St Unit A238
- 490 E 700 S Unit 524
Your Personal Tour Guide
Ask me questions while you tour the home.