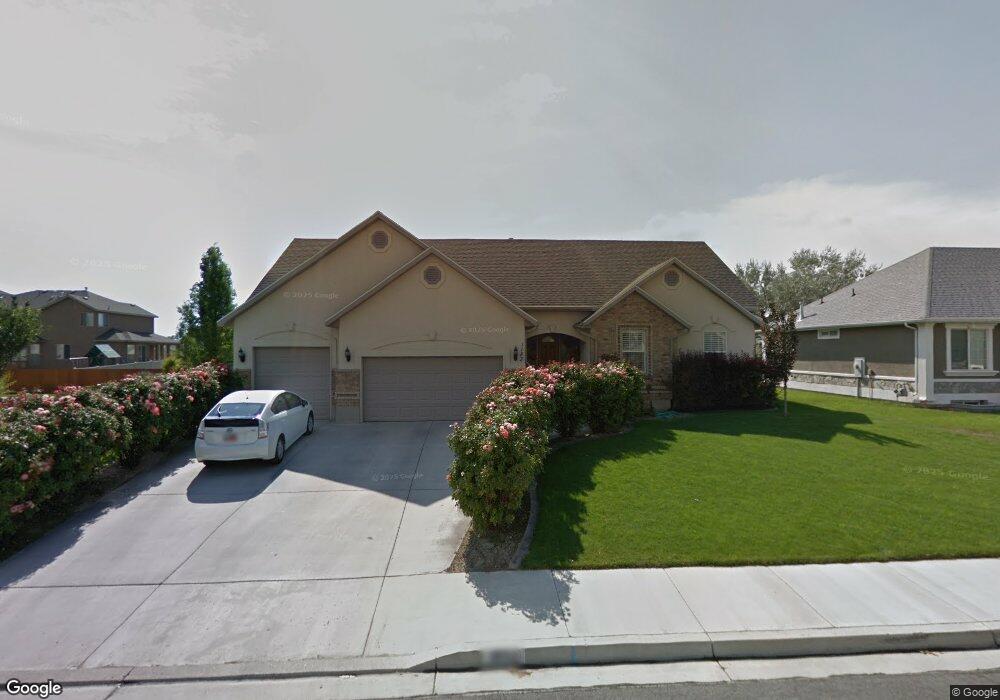
1183 N 1150 E American Fork, UT 84003
Estimated Value: $710,000 - $941,000
4
Beds
4
Baths
2,143
Sq Ft
$364/Sq Ft
Est. Value
About This Home
This home is located at 1183 N 1150 E, American Fork, UT 84003 and is currently estimated at $780,780, approximately $364 per square foot. 1183 N 1150 E is a home located in Utah County with nearby schools including Deerfield Elementary School, Mountain Ridge Junior High School, and American Fork High School.
Ownership History
Date
Name
Owned For
Owner Type
Purchase Details
Closed on
Aug 26, 2020
Sold by
Miller Jason Scot and Miller Lisa Ann
Bought by
Miller Jason S and Miller Lisa A
Current Estimated Value
Home Financials for this Owner
Home Financials are based on the most recent Mortgage that was taken out on this home.
Original Mortgage
$436,000
Outstanding Balance
$386,921
Interest Rate
2.9%
Mortgage Type
New Conventional
Estimated Equity
$393,859
Purchase Details
Closed on
May 27, 2003
Sold by
Swain Keith G and Swain Karma P
Bought by
Miller Jason S and Miller Lisa A
Purchase Details
Closed on
Oct 31, 2002
Sold by
Deseret Purchasing & Marketing Llc
Bought by
Swain Keith G and Swain Karma P
Home Financials for this Owner
Home Financials are based on the most recent Mortgage that was taken out on this home.
Original Mortgage
$169,500
Interest Rate
5.99%
Create a Home Valuation Report for This Property
The Home Valuation Report is an in-depth analysis detailing your home's value as well as a comparison with similar homes in the area
Home Values in the Area
Average Home Value in this Area
Purchase History
| Date | Buyer | Sale Price | Title Company |
|---|---|---|---|
| Miller Jason S | -- | None Available | |
| Miller Jason Scot | -- | Rudd & Hawkes Ttl Ins Agcy L | |
| Miller Jason S | -- | Horizon Title | |
| Swain Keith G | -- | Horizon Title |
Source: Public Records
Mortgage History
| Date | Status | Borrower | Loan Amount |
|---|---|---|---|
| Open | Miller Jason Scot | $436,000 | |
| Previous Owner | Swain Keith G | $169,500 |
Source: Public Records
Tax History Compared to Growth
Tax History
| Year | Tax Paid | Tax Assessment Tax Assessment Total Assessment is a certain percentage of the fair market value that is determined by local assessors to be the total taxable value of land and additions on the property. | Land | Improvement |
|---|---|---|---|---|
| 2025 | $2,965 | $365,475 | $241,000 | $423,500 |
| 2024 | $2,965 | $329,450 | $0 | $0 |
| 2023 | $2,729 | $321,420 | $0 | $0 |
| 2022 | $2,837 | $329,780 | $0 | $0 |
| 2021 | $2,492 | $452,500 | $168,700 | $283,800 |
| 2020 | $2,422 | $426,500 | $156,200 | $270,300 |
| 2019 | $2,282 | $415,600 | $145,300 | $270,300 |
| 2018 | $2,344 | $408,300 | $138,000 | $270,300 |
| 2017 | $2,153 | $202,400 | $0 | $0 |
| 2016 | $2,300 | $200,860 | $0 | $0 |
| 2015 | $2,195 | $181,940 | $0 | $0 |
| 2014 | $2,000 | $163,515 | $0 | $0 |
Source: Public Records
Map
Nearby Homes
- 1162 E 1180 N
- 1243 N 1270 E
- 1228 E 1030 N
- 1058 N 930 E Unit 64
- 1172 Murdock Dr
- 1089 N 950 E
- 1059 N 930 E
- The McKenzie Plan at Autumn Crest
- The Christine Plan at Autumn Crest
- The Avery Plan at Autumn Crest
- The Madison Plan at Autumn Crest
- The Roosevelt Plan at Autumn Crest
- The Annie Plan at Autumn Crest
- The Michelle Plan at Autumn Crest
- 1053 N 930 E Unit 73
- 1045 N 930 E Unit 58
- 4441 W Bridgestone Dr
- 9587 N 4500 W
- 248 N Deerfield Ln
- 9681 N Peach Ct