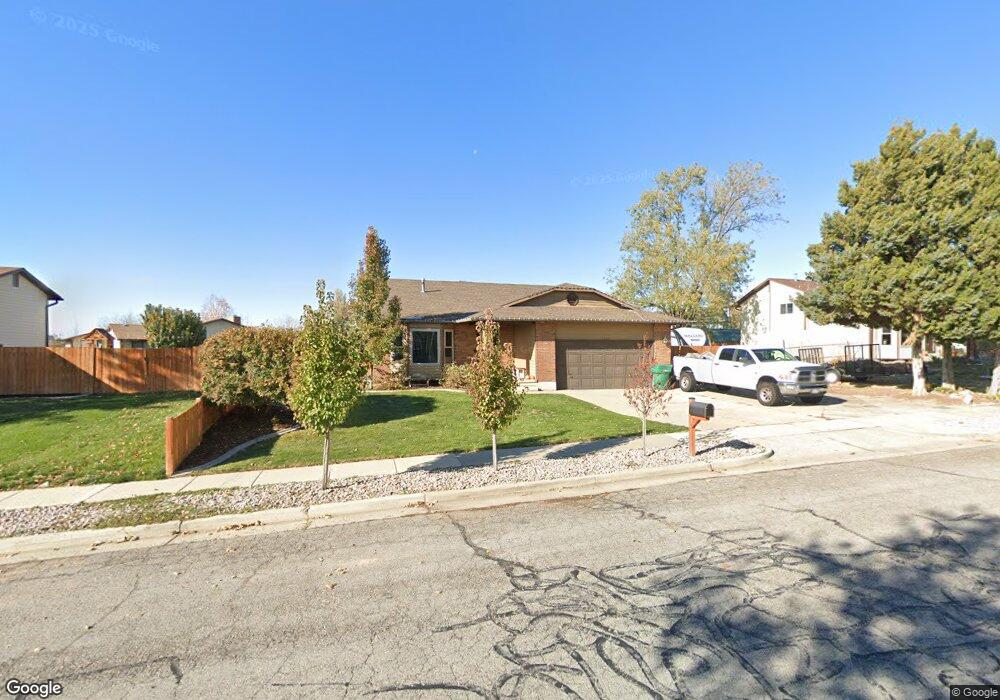
1183 N 2100 W Layton, UT 84041
Estimated Value: $445,000 - $457,000
4
Beds
2
Baths
1,965
Sq Ft
$231/Sq Ft
Est. Value
About This Home
This home is located at 1183 N 2100 W, Layton, UT 84041 and is currently estimated at $453,606, approximately $230 per square foot. 1183 N 2100 W is a home located in Davis County with nearby schools including Ellison Park School, Shoreline Junior High School, and Layton High School.
Ownership History
Date
Name
Owned For
Owner Type
Purchase Details
Closed on
Jun 13, 2022
Sold by
Porter Brody R
Bought by
Porter Brody R and Porter Haylee
Current Estimated Value
Home Financials for this Owner
Home Financials are based on the most recent Mortgage that was taken out on this home.
Original Mortgage
$366,300
Outstanding Balance
$348,039
Interest Rate
5.27%
Mortgage Type
FHA
Estimated Equity
$105,567
Purchase Details
Closed on
Dec 17, 2013
Sold by
Yokoi Shawn
Bought by
Bennett Justin
Purchase Details
Closed on
Feb 9, 2012
Sold by
Goorman Steven
Bought by
Yokoi Shawn
Home Financials for this Owner
Home Financials are based on the most recent Mortgage that was taken out on this home.
Original Mortgage
$146,483
Interest Rate
3.9%
Mortgage Type
VA
Purchase Details
Closed on
Jul 12, 2011
Sold by
Thomas Nicholas J
Bought by
Goorman Steve
Purchase Details
Closed on
Mar 11, 1998
Sold by
Thomas Debra K
Bought by
Thomas Nicholas J
Create a Home Valuation Report for This Property
The Home Valuation Report is an in-depth analysis detailing your home's value as well as a comparison with similar homes in the area
Home Values in the Area
Average Home Value in this Area
Purchase History
| Date | Buyer | Sale Price | Title Company |
|---|---|---|---|
| Porter Brody R | -- | First American Title | |
| Bennett Justin | -- | First American Title | |
| Yokoi Shawn | -- | Inwest Title Services | |
| Goorman Steve | $144,070 | None Available | |
| Thomas Nicholas J | -- | Security Title Company |
Source: Public Records
Mortgage History
| Date | Status | Borrower | Loan Amount |
|---|---|---|---|
| Open | Porter Brody R | $366,300 | |
| Previous Owner | Yokoi Shawn | $146,483 |
Source: Public Records
Tax History Compared to Growth
Tax History
| Year | Tax Paid | Tax Assessment Tax Assessment Total Assessment is a certain percentage of the fair market value that is determined by local assessors to be the total taxable value of land and additions on the property. | Land | Improvement |
|---|---|---|---|---|
| 2025 | $2,347 | $246,400 | $114,173 | $132,227 |
| 2024 | $2,273 | $240,350 | $125,611 | $114,739 |
| 2023 | $2,173 | $405,000 | $125,669 | $279,331 |
| 2022 | $2,364 | $239,250 | $77,663 | $161,587 |
| 2021 | $2,027 | $306,000 | $116,514 | $189,486 |
| 2020 | $1,823 | $264,000 | $98,253 | $165,747 |
| 2019 | $1,777 | $252,000 | $100,366 | $151,634 |
| 2018 | $1,594 | $227,000 | $88,078 | $138,922 |
| 2016 | $1,339 | $98,340 | $34,829 | $63,511 |
| 2015 | $1,279 | $89,210 | $34,829 | $54,381 |
| 2014 | $1,221 | $87,033 | $34,829 | $52,204 |
| 2013 | -- | $86,008 | $20,680 | $65,328 |
Source: Public Records
Map
Nearby Homes
- 2115 W 1225 N
- 1452 N 1875 W Unit 146
- 1451 N 1875 W Unit 168
- 1455 N 1875 W Unit 167
- 1459 N 1875 W
- 1459 N 1875 W Unit 166
- 1463 N 1875 W Unit 165
- 1463 N 1875 W
- 1479 N 1875 W
- 1479 N 1875 W Unit 161
- 1483 N 1875 W
- 1487 N 1875 W
- 1487 N 1875 W Unit 159
- 1491 N 1875 W
- 1491 N 1875 W Unit 158
- 1211 N 1875 W Unit 211
- 1211 N 1875 W
- 1476 N 1875 W Unit 164
- 1430 N 2100 W
- 979 Cold Creek Way