1183 N 380 E Tooele, UT 84074
Estimated Value: $406,000 - $436,000
5
Beds
2
Baths
2,318
Sq Ft
$183/Sq Ft
Est. Value
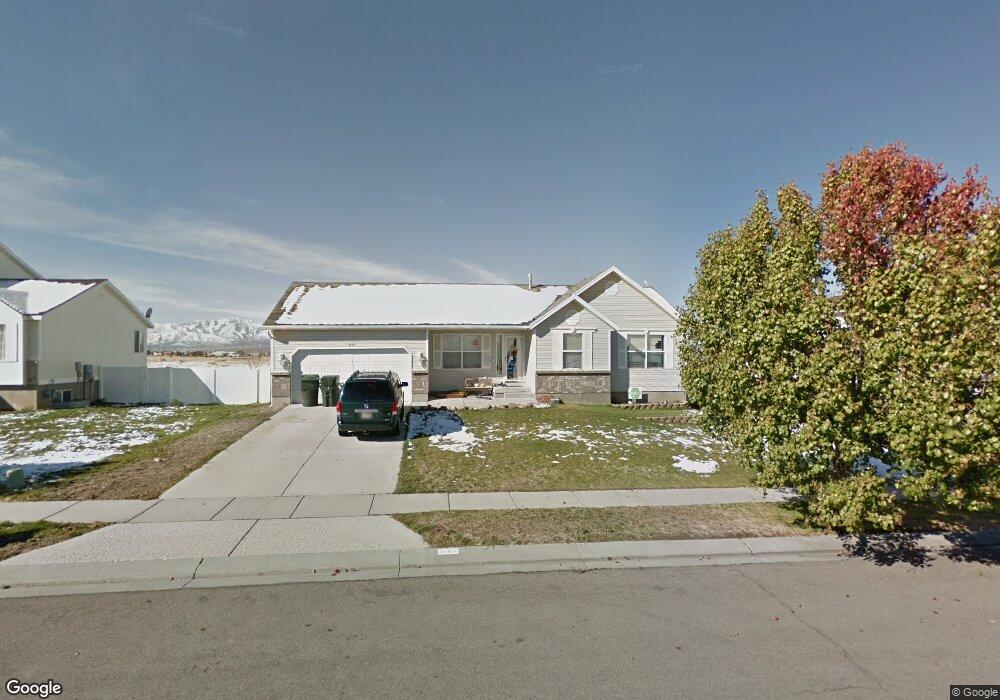
About This Home
This home is located at 1183 N 380 E, Tooele, UT 84074 and is currently estimated at $423,176, approximately $182 per square foot. 1183 N 380 E is a home located in Tooele County with nearby schools including Copper Canyon Elementary School, Clarke N. Johnsen Junior High School, and Stansbury High School.
Ownership History
Date
Name
Owned For
Owner Type
Purchase Details
Closed on
Dec 26, 2007
Sold by
Harmon Nicholas and Harmon Diana R
Bought by
Elwood Aaron and Elwood Rebecca
Current Estimated Value
Home Financials for this Owner
Home Financials are based on the most recent Mortgage that was taken out on this home.
Original Mortgage
$205,640
Outstanding Balance
$129,736
Interest Rate
6.15%
Mortgage Type
FHA
Estimated Equity
$293,440
Purchase Details
Closed on
Dec 12, 2005
Sold by
Petersen James Bud and Petersen Julie B
Bought by
Harmon Nicholas and Harmon Diana R
Home Financials for this Owner
Home Financials are based on the most recent Mortgage that was taken out on this home.
Original Mortgage
$29,980
Interest Rate
6.31%
Mortgage Type
Stand Alone Second
Create a Home Valuation Report for This Property
The Home Valuation Report is an in-depth analysis detailing your home's value as well as a comparison with similar homes in the area
Home Values in the Area
Average Home Value in this Area
Purchase History
| Date | Buyer | Sale Price | Title Company |
|---|---|---|---|
| Elwood Aaron | -- | Merrill Title Co | |
| Harmon Nicholas | -- | Surety Title |
Source: Public Records
Mortgage History
| Date | Status | Borrower | Loan Amount |
|---|---|---|---|
| Open | Elwood Aaron | $205,640 | |
| Closed | Harmon Nicholas | $29,980 |
Source: Public Records
Tax History Compared to Growth
Tax History
| Year | Tax Paid | Tax Assessment Tax Assessment Total Assessment is a certain percentage of the fair market value that is determined by local assessors to be the total taxable value of land and additions on the property. | Land | Improvement |
|---|---|---|---|---|
| 2025 | $2,009 | $219,745 | $56,375 | $163,370 |
| 2024 | $2,134 | $213,434 | $56,375 | $157,059 |
| 2023 | $2,134 | $227,476 | $53,689 | $173,787 |
| 2022 | $2,653 | $228,224 | $53,453 | $174,771 |
| 2021 | $2,165 | $155,820 | $21,381 | $134,439 |
| 2020 | $2,076 | $259,087 | $38,875 | $220,212 |
| 2019 | $1,947 | $239,068 | $38,875 | $200,193 |
| 2018 | $1,687 | $196,401 | $40,000 | $156,401 |
| 2017 | $1,529 | $211,208 | $30,000 | $181,208 |
| 2016 | $1,249 | $103,165 | $16,500 | $86,665 |
| 2015 | $1,249 | $90,840 | $0 | $0 |
| 2014 | -- | $90,840 | $0 | $0 |
Source: Public Records
Map
Nearby Homes