Estimated Value: $519,000 - $716,000
3
Beds
2
Baths
1,403
Sq Ft
$441/Sq Ft
Est. Value
About This Home
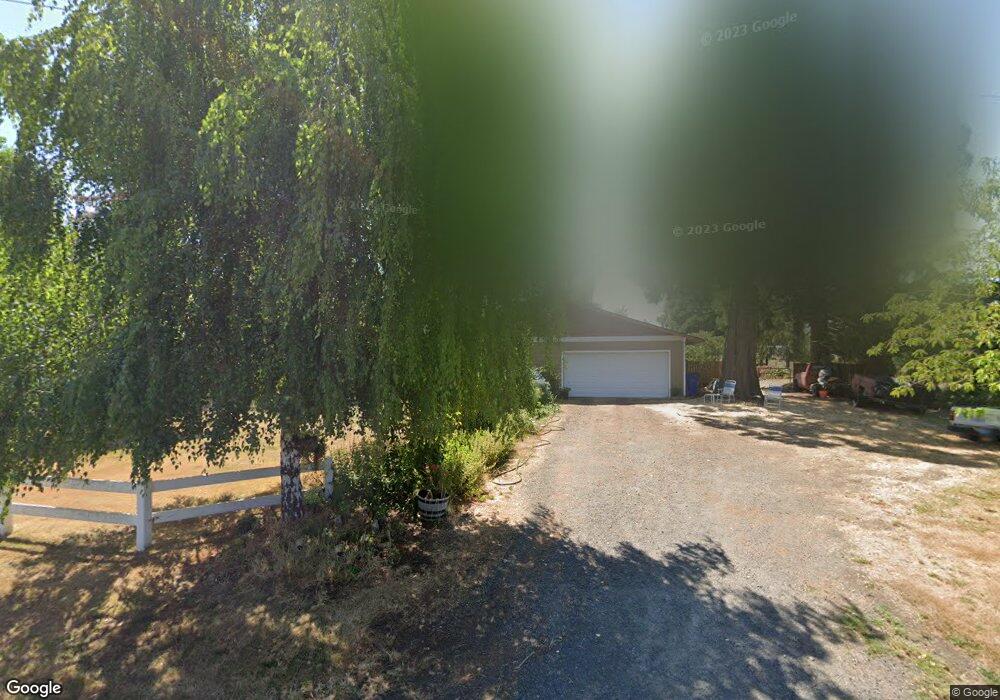
This home is located at 11832 S Eby Rd, Canby, OR 97013 and is currently estimated at $619,226, approximately $441 per square foot. 11832 S Eby Rd is a home located in Clackamas County.
Ownership History
Date
Name
Owned For
Owner Type
Purchase Details
Closed on
Aug 28, 2008
Sold by
Gilson Mary Margaret
Bought by
Gilson Mary Margaret and Mary M Gilson Revocable Trust
Current Estimated Value
Purchase Details
Closed on
Jun 30, 2006
Sold by
Thompson Dustin and Thompson Stephanie L
Bought by
Gilson Mary
Home Financials for this Owner
Home Financials are based on the most recent Mortgage that was taken out on this home.
Original Mortgage
$35,000
Outstanding Balance
$20,646
Interest Rate
6.63%
Mortgage Type
Credit Line Revolving
Estimated Equity
$598,580
Purchase Details
Closed on
May 6, 2003
Sold by
Federal National Mortgage Association
Bought by
Thompson Dustin and Sturm Stephanie L
Home Financials for this Owner
Home Financials are based on the most recent Mortgage that was taken out on this home.
Original Mortgage
$123,920
Interest Rate
5.84%
Purchase Details
Closed on
Aug 22, 2002
Sold by
Stoner Esther M
Bought by
Washington Mutual Bank Fa
Create a Home Valuation Report for This Property
The Home Valuation Report is an in-depth analysis detailing your home's value as well as a comparison with similar homes in the area
Home Values in the Area
Average Home Value in this Area
Purchase History
| Date | Buyer | Sale Price | Title Company |
|---|---|---|---|
| Gilson Mary Margaret | -- | None Available | |
| Gilson Mary | $350,000 | Pacific Nw Title | |
| Thompson Dustin | $154,900 | Chicago Title Insurance Comp | |
| Washington Mutual Bank Fa | $159,823 | -- |
Source: Public Records
Mortgage History
| Date | Status | Borrower | Loan Amount |
|---|---|---|---|
| Open | Gilson Mary | $35,000 | |
| Open | Gilson Mary | $280,000 | |
| Previous Owner | Thompson Dustin | $123,920 | |
| Closed | Thompson Dustin | $30,980 |
Source: Public Records
Tax History Compared to Growth
Tax History
| Year | Tax Paid | Tax Assessment Tax Assessment Total Assessment is a certain percentage of the fair market value that is determined by local assessors to be the total taxable value of land and additions on the property. | Land | Improvement |
|---|---|---|---|---|
| 2025 | $3,114 | $230,120 | -- | -- |
| 2024 | $3,014 | $223,418 | -- | -- |
| 2023 | $3,014 | $216,911 | $0 | $0 |
| 2022 | $2,517 | $210,594 | $0 | $0 |
| 2021 | $2,402 | $204,461 | $0 | $0 |
| 2020 | $2,336 | $198,506 | $0 | $0 |
| 2019 | $2,268 | $192,725 | $0 | $0 |
| 2018 | $2,205 | $187,112 | $0 | $0 |
| 2017 | $2,082 | $181,662 | $0 | $0 |
| 2016 | $1,953 | $176,371 | $0 | $0 |
| 2015 | $1,898 | $171,234 | $0 | $0 |
| 2014 | $1,836 | $166,247 | $0 | $0 |
Source: Public Records
Map
Nearby Homes
- 12403 S Eby Rd
- 10787 S Heinz Rd
- 12051 S Riggs Damm Rd
- 11600 S Emerson Rd
- 29891 S Highway 213
- 30593 S Elisha Rd
- 0 S MacKsburg Rd
- 30683 S Highway 213
- 28502 Oregon 213
- 28502 S Highway 213
- 701 Oriental Ct
- 714 Saint James Place
- 33953 Oregon 213
- 14001 S Union Mills Rd
- 863 June Dr
- 947 Meadowlark Place
- 9750 S Gribble Rd
- 26740 S Fish Rd
- 31514 S Bear Meadow Ct
- 26684 S Fish Rd
- 11796 S Eby Rd
- 11614 S Eby Rd
- 11738 S Eby Rd
- 11854 S Eby Rd
- 11890 S Eby Rd
- 11699 S Eby Rd
- 28959 S Cramer Rd
- 11958 S Eby Rd
- 11579 S Eby Rd
- 28857 S Cramer Rd
- 11874 S Eby Rd
- 11521 S Eby Rd
- 28932 S Cramer Rd
- 29146 S Cramer Rd
- 28991 S Cramer Rd
- 12106 S Eby Rd
- 28747 S Cramer Rd
- 29156 S Cramer Rd
- 28715 S Cramer Rd
- 29265 S Cramer Rd