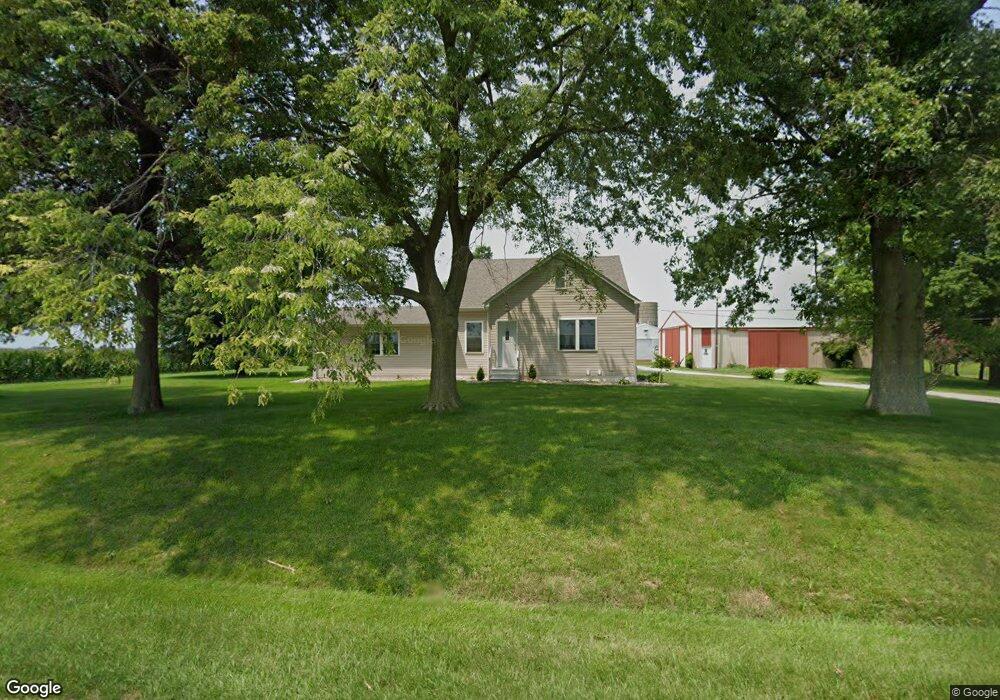
11835 Summerfield Saint Jacob Rd Trenton, IL 62293
Estimated Value: $207,000 - $327,000
--
Bed
--
Bath
972
Sq Ft
$303/Sq Ft
Est. Value
About This Home
This home is located at 11835 Summerfield Saint Jacob Rd, Trenton, IL 62293 and is currently estimated at $294,102, approximately $302 per square foot. 11835 Summerfield Saint Jacob Rd is a home located in St. Clair County with nearby schools including Lebanon Elementary School and Lebanon High School.
Ownership History
Date
Name
Owned For
Owner Type
Purchase Details
Closed on
Dec 3, 2022
Sold by
Higgins Dorothy Marie
Bought by
Staudenmaier Lisa Marie and Dorothy Marie Higgins Irrevocable Trust
Current Estimated Value
Purchase Details
Closed on
Jun 14, 2014
Sold by
Carpenter Roxie A and Carpenter Donus E
Bought by
Higgins Raymond P and Higgins Dorothy M
Home Financials for this Owner
Home Financials are based on the most recent Mortgage that was taken out on this home.
Original Mortgage
$152,000
Interest Rate
4.5%
Mortgage Type
Purchase Money Mortgage
Purchase Details
Closed on
Jan 13, 2011
Sold by
Woods Harold L and Woods Roxie A
Bought by
Woods Roxie A
Purchase Details
Closed on
Dec 11, 2001
Sold by
Kirsch Glenn M and Kirsch Audrey J
Bought by
Woods Harold L and Woods Roxie A
Home Financials for this Owner
Home Financials are based on the most recent Mortgage that was taken out on this home.
Original Mortgage
$203,000
Interest Rate
7.25%
Create a Home Valuation Report for This Property
The Home Valuation Report is an in-depth analysis detailing your home's value as well as a comparison with similar homes in the area
Home Values in the Area
Average Home Value in this Area
Purchase History
| Date | Buyer | Sale Price | Title Company |
|---|---|---|---|
| Staudenmaier Lisa Marie | -- | None Available | |
| Higgins Raymond P | $160,000 | Title Center Llc | |
| Woods Roxie A | -- | None Available | |
| Woods Harold L | $220,000 | -- |
Source: Public Records
Mortgage History
| Date | Status | Borrower | Loan Amount |
|---|---|---|---|
| Previous Owner | Higgins Raymond P | $152,000 | |
| Previous Owner | Woods Harold L | $203,000 |
Source: Public Records
Tax History Compared to Growth
Tax History
| Year | Tax Paid | Tax Assessment Tax Assessment Total Assessment is a certain percentage of the fair market value that is determined by local assessors to be the total taxable value of land and additions on the property. | Land | Improvement |
|---|---|---|---|---|
| 2024 | $4,453 | $68,682 | $6,262 | $62,420 |
| 2023 | $4,269 | $65,269 | $5,782 | $59,487 |
| 2022 | $3,991 | $60,967 | $5,286 | $55,681 |
| 2021 | $3,828 | $56,024 | $3,873 | $52,151 |
| 2020 | $3,666 | $51,201 | $3,495 | $47,706 |
| 2019 | $3,494 | $51,083 | $3,377 | $47,706 |
| 2018 | $3,364 | $49,595 | $3,197 | $46,398 |
| 2017 | $3,023 | $45,265 | $2,911 | $42,354 |
| 2016 | $2,993 | $44,886 | $2,836 | $42,050 |
| 2014 | $3,695 | $44,597 | $2,665 | $41,932 |
| 2013 | $3,289 | $43,337 | $2,724 | $40,613 |
Source: Public Records
Map
Nearby Homes
- 9756 Meriwether Dr
- 9757 Meriwether Dr
- 9748 Meriwether Dr
- 9749 Meriwether Dr
- 9728 Meriwether Dr
- 10966 Old U S Highway 50
- 10962 Kentfield Dr
- 307 W Peeples St
- 10909 Kentfield Dr
- 10904 Upland Terrace Dr
- 405 Acorn Way
- 703 N Pearl St
- 218 N Herman St
- 614 N Monroe St
- 19 Saint Joseph Dr
- 610 N Harrison St
- 216 E Main St
- 214 E Main St
- 227 Roosevelt St
- 660 W 3rd St
- 11835 Summerfield Rd
- 11706 Summerfield Saint Jacob Rd
- 11030 Seger Rd
- 10848 Seger Rd
- 10848 Seger Rd
- 11105 Seger Rd
- 87 Summerfield Rd
- 93 Summerfield Rd
- 10793 Seger Rd
- 11166 Seger Rd
- 10774 Hill Ridge Dr
- 10764 Hill Ridge Dr
- 10754 Hill Ridge Dr
- 10747 Hill Ridge Dr
- 10744 Hill Ridge Dr
- 10734 Hill Ridge Dr
- 10784 Hill Ridge Dr
- 10794 Hill Ridge Dr
- 93 Summerfield Rd
- 11525 Summerfield Stjacob Rd