11836 Bayport Ln Unit 2204 Fort Myers, FL 33908
Estimated Value: $332,000 - $404,000
4
Beds
2
Baths
2,203
Sq Ft
$168/Sq Ft
Est. Value
About This Home
This home is located at 11836 Bayport Ln Unit 2204, Fort Myers, FL 33908 and is currently estimated at $369,969, approximately $167 per square foot. 11836 Bayport Ln Unit 2204 is a home located in Lee County with nearby schools including Allen Park Elementary School, Edison Park Creative & Expressive Arts School, and Bonita Springs Elementary School.
Ownership History
Date
Name
Owned For
Owner Type
Purchase Details
Closed on
Jul 30, 2010
Sold by
Fannie Mae
Bought by
Whitzell Brian E and Whitzell Lori
Current Estimated Value
Purchase Details
Closed on
Jun 2, 2010
Sold by
Derck James W
Bought by
Federal National Mortgage Association
Purchase Details
Closed on
Dec 22, 2008
Sold by
Derck Janet M
Bought by
Derck John C
Purchase Details
Closed on
Dec 17, 2008
Sold by
Derck Patricia A
Bought by
Derck James W
Purchase Details
Closed on
Nov 22, 2006
Sold by
Avalon Preserve Developers Llc
Bought by
Derck John C and Derck Janet M
Home Financials for this Owner
Home Financials are based on the most recent Mortgage that was taken out on this home.
Original Mortgage
$315,000
Interest Rate
6.33%
Mortgage Type
Unknown
Create a Home Valuation Report for This Property
The Home Valuation Report is an in-depth analysis detailing your home's value as well as a comparison with similar homes in the area
Home Values in the Area
Average Home Value in this Area
Purchase History
| Date | Buyer | Sale Price | Title Company |
|---|---|---|---|
| Whitzell Brian E | $115,000 | Attorney | |
| Federal National Mortgage Association | -- | None Available | |
| Derck John C | -- | Attorney | |
| Derck James W | -- | Attorney | |
| Derck John C | $358,300 | Fidelity National Title Ins |
Source: Public Records
Mortgage History
| Date | Status | Borrower | Loan Amount |
|---|---|---|---|
| Previous Owner | Derck John C | $315,000 |
Source: Public Records
Tax History Compared to Growth
Tax History
| Year | Tax Paid | Tax Assessment Tax Assessment Total Assessment is a certain percentage of the fair market value that is determined by local assessors to be the total taxable value of land and additions on the property. | Land | Improvement |
|---|---|---|---|---|
| 2025 | $4,382 | $313,419 | -- | -- |
| 2024 | $4,524 | $284,926 | -- | -- |
| 2023 | $4,524 | $259,024 | $0 | $0 |
| 2022 | $3,826 | $235,476 | $0 | $0 |
| 2021 | $3,279 | $217,171 | $0 | $217,171 |
| 2020 | $3,029 | $194,608 | $0 | $194,608 |
| 2019 | $3,051 | $194,608 | $0 | $194,608 |
| 2018 | $3,118 | $194,608 | $0 | $194,608 |
| 2017 | $3,046 | $192,993 | $0 | $192,993 |
| 2016 | $3,251 | $234,965 | $0 | $234,965 |
| 2015 | $2,633 | $156,900 | $0 | $156,900 |
| 2014 | $2,386 | $138,800 | $0 | $138,800 |
| 2013 | -- | $123,200 | $0 | $123,200 |
Source: Public Records
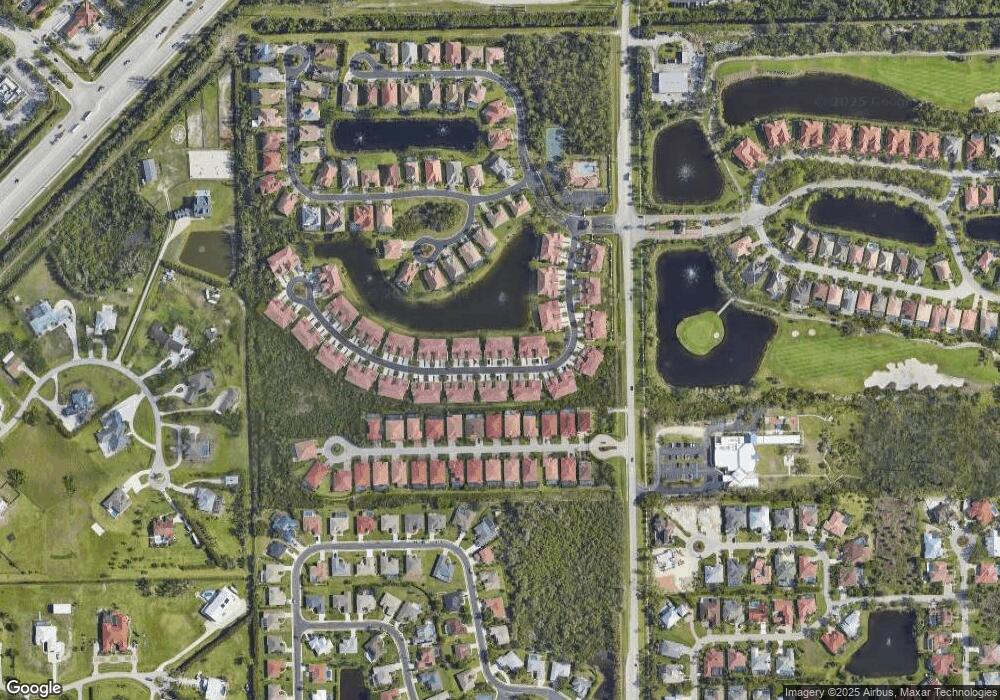
Map
Nearby Homes
- 11825 Bayport Ln Unit 504
- 11801 Bayport Ln Unit 104
- 8741 Westwood Oaks Place
- 11865 Bayport Ln Unit 1202
- 11875 Bayport Ln Unit 1402
- 8738 Lakefront Ct
- 8726 Lakefront Ct
- 8896 Bracken Way
- 8886 Staghorn Way
- 8867 Staghorn Way
- 8970 Greenwich Hills Way Unit 102
- 8980 Bracken Way
- 19681 #252 Summerlin Rd
- 19681 D338 Summerlin Rd
- 16524 Wellington Lakes Cir
- 8698 Colony Trace Dr
- 16525 Wellington Lakes Cir
- 8921 Crown Colony Blvd
- 8929 Greenwich Hills Way
- 16530 Whispering Trace Ct
- 11836 Bayport Ln Unit 4
- 11836 Bayport Ln Unit 2202
- 11836 Bayport Ln Unit 2203
- 11836 Bayport Ln Unit 2201
- 11830 Bayport Ln Unit 4
- 11830 Bayport Ln Unit 2303
- 11830 Bayport Ln Unit 2301
- 11830 Bayport Ln Unit 2302
- 11830 Bayport Ln Unit 2304
- 11837 Bayport Ln Unit 703
- 11837 Bayport Ln Unit 701
- 11837 Bayport Ln Unit 702
- 11837 Bayport Ln Unit 704
- 11842 Bayport Ln Unit 2101
- 11842 Bayport Ln Unit 2102
- 11842 Bayport Ln Unit 2103
- 11831 Bayport Ln Unit 602
- 11831 Bayport Ln Unit 604
- 11831 Bayport Ln Unit 603
- 11831 Bayport Ln Unit 601