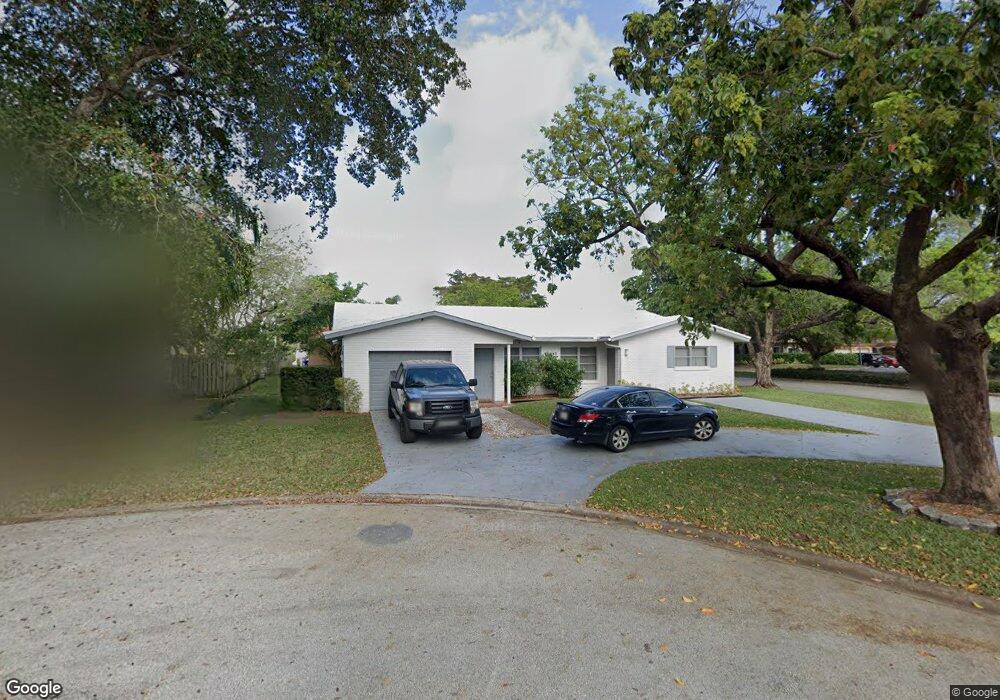
11837 NW 32nd Ct Unit 1A Coral Springs, FL 33065
Estimated Value: $577,067 - $870,000
5
Beds
4
Baths
3,271
Sq Ft
$225/Sq Ft
Est. Value
About This Home
This home is located at 11837 NW 32nd Ct Unit 1A, Coral Springs, FL 33065 and is currently estimated at $735,767, approximately $224 per square foot. 11837 NW 32nd Ct Unit 1A is a home located in Broward County with nearby schools including Westchester Elementary School, Sawgrass Springs Middle School, and Coral Glades High School.
Ownership History
Date
Name
Owned For
Owner Type
Purchase Details
Closed on
Jan 20, 2022
Sold by
Drd Properties Llc
Bought by
Wjeww Investments Llc
Current Estimated Value
Purchase Details
Closed on
Aug 28, 2013
Sold by
Salerno Donna L
Bought by
Drd Properties Llc
Purchase Details
Closed on
Jun 19, 2009
Sold by
Salerno Donna L
Bought by
Salerno Donna L
Purchase Details
Closed on
Jul 25, 2006
Sold by
Dykema Dale R
Bought by
Dykema Dale R and Salerno Donna L
Purchase Details
Closed on
Apr 28, 1994
Sold by
Bosco Philip J and Bosco Constance J
Bought by
Dykema Dale R
Home Financials for this Owner
Home Financials are based on the most recent Mortgage that was taken out on this home.
Original Mortgage
$99,000
Interest Rate
7.81%
Mortgage Type
Commercial
Create a Home Valuation Report for This Property
The Home Valuation Report is an in-depth analysis detailing your home's value as well as a comparison with similar homes in the area
Home Values in the Area
Average Home Value in this Area
Purchase History
| Date | Buyer | Sale Price | Title Company |
|---|---|---|---|
| Wjeww Investments Llc | $639,000 | Capital Abstract & Title | |
| Drd Properties Llc | $240,000 | Indeed Title Corp | |
| Salerno Donna L | -- | None Available | |
| Dykema Dale R | -- | Attorney | |
| Dykema Dale R | $110,000 | -- |
Source: Public Records
Mortgage History
| Date | Status | Borrower | Loan Amount |
|---|---|---|---|
| Previous Owner | Dykema Dale R | $99,000 |
Source: Public Records
Tax History Compared to Growth
Tax History
| Year | Tax Paid | Tax Assessment Tax Assessment Total Assessment is a certain percentage of the fair market value that is determined by local assessors to be the total taxable value of land and additions on the property. | Land | Improvement |
|---|---|---|---|---|
| 2025 | $14,136 | $648,920 | -- | -- |
| 2024 | $12,827 | $616,250 | $85,750 | $530,500 |
| 2023 | $12,827 | $536,300 | $85,750 | $450,550 |
| 2022 | $10,382 | $427,210 | $0 | $0 |
| 2021 | $9,592 | $388,380 | $0 | $0 |
| 2020 | $8,833 | $385,170 | $85,750 | $299,420 |
| 2019 | $8,402 | $381,180 | $85,750 | $295,430 |
| 2018 | $7,057 | $295,890 | $85,750 | $210,140 |
| 2017 | $6,520 | $265,290 | $0 | $0 |
| 2016 | $5,897 | $241,180 | $0 | $0 |
| 2015 | $5,460 | $219,260 | $0 | $0 |
| 2014 | $5,052 | $200,700 | $0 | $0 |
| 2013 | -- | $194,040 | $85,750 | $108,290 |
Source: Public Records
Map
Nearby Homes
- 3242 Coral Ridge Dr Unit 3242
- 3218 Coral Ridge Dr Unit 3218
- 3220 Coral Ridge Dr Unit 3220
- 3134 Coral Ridge Dr Unit 3136
- 3035 Coral Ridge Dr Unit 3035
- 11515 NW 32nd Ct
- 12033 NW 29th St
- 11604 NW 29th Ct Unit C4
- 11607 NW 29th St Unit 3B
- 3600 NW 116th Terrace
- 3501 NW 114th Ln
- 11550 NW 36th St
- 3525 NW 114th Ln
- 3760 NW 115th Way Unit 122
- 11618 NW 27th St
- 11390 NW 37th St
- 3775 NW 116th Terrace
- 2841 NW 112th Ave
- 11957 NW 26th Place
- 3750 NW 115th Way Unit 111
- 11837 NW 32nd Ct Unit 1B
- 11837 NW 32nd Ct
- 11813 NW 32nd Ct
- 3259 NW 118th Ln
- 3237 NW 118th Ln
- 3213 NW 118th Ln
- 11808 NW 32nd Ct
- 11806 NW 32nd Ct
- 3215 NW 118th Dr
- 3199 NW 118th Ln
- 3270 NW 118th Ln
- 3195 NW 118th Dr
- 3268 NW 118th Ln
- 3193 NW 118th Dr Unit 1-2
- 3193 NW 118th Dr
- 3193-3195 NW 118th Dr Unit 1-2
- 11899 NW 31st St
- 11913 NW 31st St
- 11873 NW 31st St