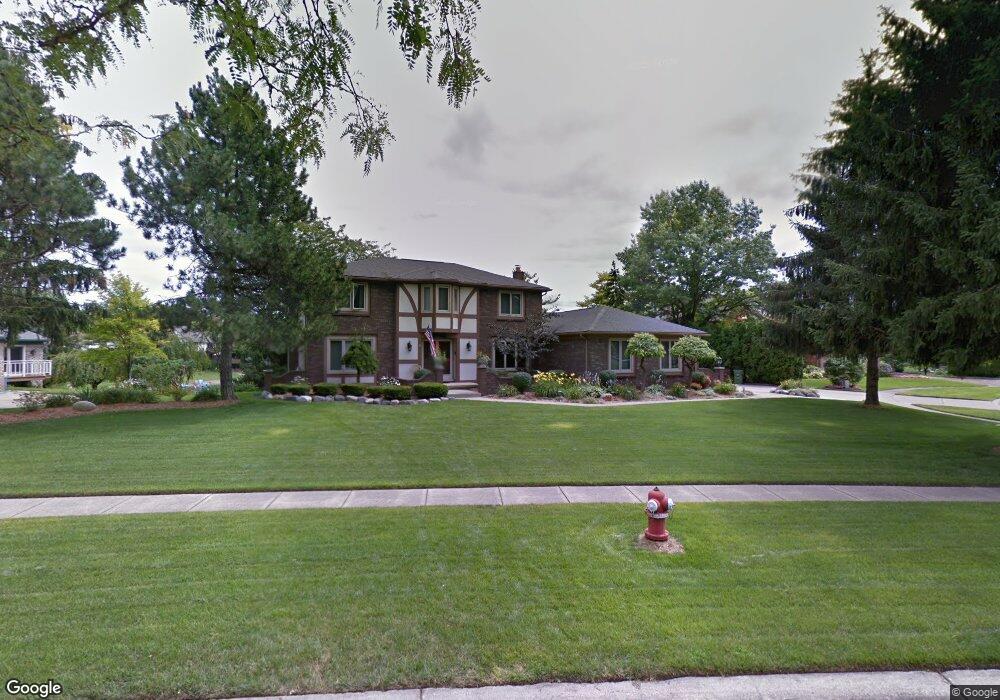
11848 Shawnee Point Unit Bldg-Unit Shelby Township, MI 48315
Estimated Value: $603,641 - $692,000
4
Beds
4
Baths
3,122
Sq Ft
$203/Sq Ft
Est. Value
About This Home
This home is located at 11848 Shawnee Point Unit Bldg-Unit, Shelby Township, MI 48315 and is currently estimated at $634,160, approximately $203 per square foot. 11848 Shawnee Point Unit Bldg-Unit is a home located in Macomb County with nearby schools including Crissman Elementary School, Malow Junior High School, and Eisenhower High School.
Ownership History
Date
Name
Owned For
Owner Type
Purchase Details
Closed on
Aug 13, 2018
Sold by
Hock Robert D
Bought by
Mckay Timothy R and Mckay Carmella
Current Estimated Value
Purchase Details
Closed on
Oct 15, 2008
Sold by
Anderson Joan and Flagstar Bank Fsb
Bought by
Hock Robert D
Home Financials for this Owner
Home Financials are based on the most recent Mortgage that was taken out on this home.
Original Mortgage
$193,600
Interest Rate
4.99%
Mortgage Type
Purchase Money Mortgage
Purchase Details
Closed on
Mar 16, 2007
Sold by
Methven Robert J and Methven Lori A
Bought by
Mortgage Electronic Registration Systems
Purchase Details
Closed on
Aug 15, 1996
Sold by
Leland M
Bought by
Methven R
Purchase Details
Closed on
May 24, 1995
Sold by
Joy M Gehart
Bought by
Margaret M Leland
Create a Home Valuation Report for This Property
The Home Valuation Report is an in-depth analysis detailing your home's value as well as a comparison with similar homes in the area
Home Values in the Area
Average Home Value in this Area
Purchase History
| Date | Buyer | Sale Price | Title Company |
|---|---|---|---|
| Mckay Timothy R | $417,000 | Devon Title Agency | |
| Hock Robert D | $242,000 | 1St Choice Title Svcs Inc | |
| Flagstar Bank Fsb | -- | 1St Choice Title Svcs Inc | |
| Mortgage Electronic Registration Systems | $334,504 | None Available | |
| Methven R | $290,000 | -- | |
| Margaret M Leland | $259,000 | -- |
Source: Public Records
Mortgage History
| Date | Status | Borrower | Loan Amount |
|---|---|---|---|
| Previous Owner | Hock Robert D | $193,600 |
Source: Public Records
Tax History Compared to Growth
Tax History
| Year | Tax Paid | Tax Assessment Tax Assessment Total Assessment is a certain percentage of the fair market value that is determined by local assessors to be the total taxable value of land and additions on the property. | Land | Improvement |
|---|---|---|---|---|
| 2025 | $7,038 | $269,900 | $0 | $0 |
| 2024 | $4,166 | $259,100 | $0 | $0 |
| 2023 | $3,945 | $239,500 | $0 | $0 |
| 2022 | $6,364 | $216,600 | $0 | $0 |
| 2021 | $6,190 | $203,700 | $0 | $0 |
| 2020 | $3,632 | $198,100 | $0 | $0 |
| 2019 | $5,711 | $195,900 | $0 | $0 |
| 2018 | $4,387 | $176,300 | $0 | $0 |
| 2017 | $4,341 | $167,250 | $42,950 | $124,300 |
| 2016 | $4,310 | $167,250 | $0 | $0 |
| 2015 | $4,248 | $157,900 | $0 | $0 |
| 2013 | $2,413 | $146,350 | $0 | $0 |
Source: Public Records
Map
Nearby Homes
- 11884 Shawnee Point
- 11988 Whispering Oak Ln
- 54158 Blue Cloud Dr
- 11924 Raintree Ct
- 11970 Diamond Dr
- 54810 Blue Cloud Dr
- 12277 Forest Glen Ln
- 11812 Encore Dr
- 53781 Desano Dr
- 11731 Encore Ct
- 11948 Encore Ct
- 12020 Encore Ct
- 11695 Encore Dr
- 11982 Encore Ct
- 11762 Encore Dr
- Pinehurst II Plan at Encore of Shelby - Encore at Shelby
- Pinehurst Plan at Encore of Shelby - Encore at Shelby
- Devonshire Plan at Encore of Shelby - Encore at Shelby
- Barclay II Plan at Encore of Shelby - Encore at Shelby
- 55333 Jewell Rd
- 11848 Shawnee Point
- 11812 Shawnee Point
- 11795 Shawnee Point
- 11849 Shawnee Point
- 11776 Shawnee Point
- 11920 Shawnee Point
- 11883 Shawnee Point
- 11740 Shawnee Point
- 11741 Shawnee Point
- 54281 Iroquois Ln
- 54317 Iroquois Ln
- 11919 Shawnee Point
- 54243 Iroquois Ln
- 11725 Shawnee Point
- 54385 Iroquois Ln
- 54290 Algonquin Dr
- 54330 Algonquin Dr
- 54207 Iroquois Ln
- 11820 Whispering Oak Ln
- 11850 Whispering Oak Ln