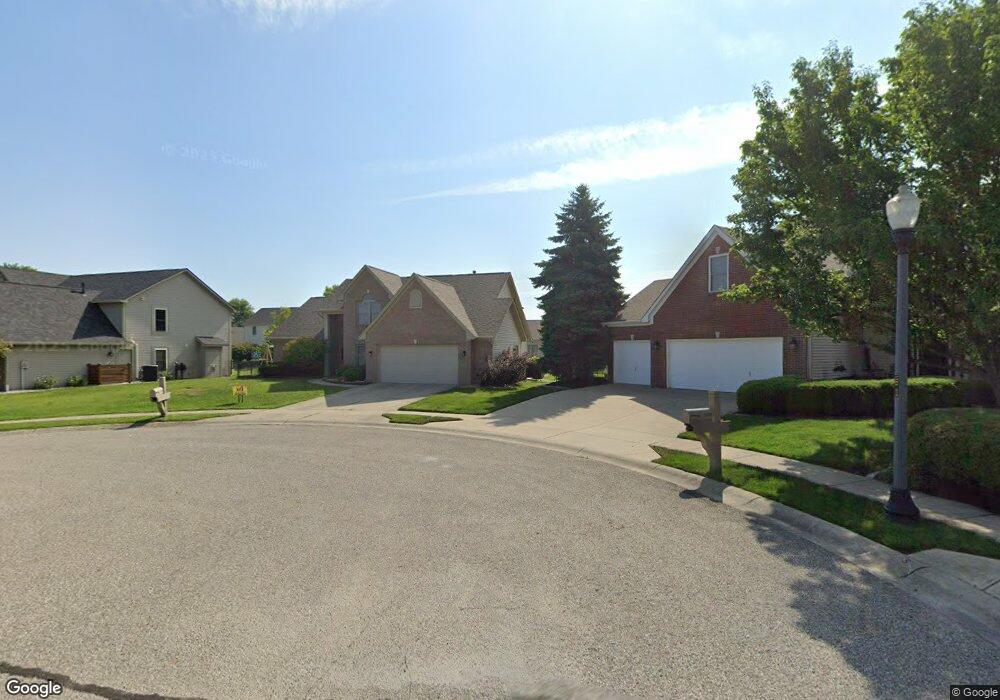
1185 Carlton Ct Greenwood, IN 46143
Estimated Value: $339,885 - $392,000
3
Beds
3
Baths
2,255
Sq Ft
$163/Sq Ft
Est. Value
About This Home
This home is located at 1185 Carlton Ct, Greenwood, IN 46143 and is currently estimated at $366,971, approximately $162 per square foot. 1185 Carlton Ct is a home located in Johnson County with nearby schools including Westwood Elementary School, Greenwood Middle School, and Greenwood Community High School.
Ownership History
Date
Name
Owned For
Owner Type
Purchase Details
Closed on
Jul 1, 2020
Sold by
Kieffer Ann W
Bought by
Cox Natalie R and Cox Michael
Current Estimated Value
Home Financials for this Owner
Home Financials are based on the most recent Mortgage that was taken out on this home.
Original Mortgage
$235,554
Outstanding Balance
$208,874
Interest Rate
3.1%
Mortgage Type
FHA
Estimated Equity
$158,097
Purchase Details
Closed on
May 14, 2008
Sold by
Glosser Russell E and Glosser Patricio A
Bought by
Kieffer Alvin B and Kieffer Ann W
Purchase Details
Closed on
Dec 27, 2004
Sold by
Huynh An Ngoc
Bought by
Glosser Russell E and Glosser Patricia A
Home Financials for this Owner
Home Financials are based on the most recent Mortgage that was taken out on this home.
Original Mortgage
$65,000
Interest Rate
5.78%
Create a Home Valuation Report for This Property
The Home Valuation Report is an in-depth analysis detailing your home's value as well as a comparison with similar homes in the area
Home Values in the Area
Average Home Value in this Area
Purchase History
| Date | Buyer | Sale Price | Title Company |
|---|---|---|---|
| Cox Natalie R | -- | Chicago Title Co Llc | |
| Kieffer Alvin B | -- | None Available | |
| Glosser Russell E | -- | None Available |
Source: Public Records
Mortgage History
| Date | Status | Borrower | Loan Amount |
|---|---|---|---|
| Open | Cox Natalie R | $235,554 | |
| Previous Owner | Glosser Russell E | $65,000 |
Source: Public Records
Tax History Compared to Growth
Tax History
| Year | Tax Paid | Tax Assessment Tax Assessment Total Assessment is a certain percentage of the fair market value that is determined by local assessors to be the total taxable value of land and additions on the property. | Land | Improvement |
|---|---|---|---|---|
| 2025 | $2,660 | $339,000 | $32,200 | $306,800 |
| 2024 | $2,660 | $281,200 | $32,200 | $249,000 |
| 2023 | $2,538 | $281,200 | $32,200 | $249,000 |
| 2022 | $2,517 | $258,200 | $29,300 | $228,900 |
| 2021 | $2,022 | $219,200 | $29,300 | $189,900 |
| 2020 | $1,863 | $202,500 | $29,300 | $173,200 |
| 2019 | $1,762 | $192,800 | $29,300 | $163,500 |
| 2018 | $1,659 | $189,200 | $29,300 | $159,900 |
| 2017 | $1,586 | $177,400 | $29,300 | $148,100 |
| 2016 | $1,603 | $180,900 | $29,300 | $151,600 |
| 2014 | $1,616 | $172,800 | $33,500 | $139,300 |
| 2013 | $1,616 | $178,800 | $33,500 | $145,300 |
Source: Public Records
Map
Nearby Homes
- 1132 Veranda Ct
- 1393 Padana Dr
- 1197 Lucca Dr
- 1119 Lazio Ct
- Emmett Plan at Brighton Knoll - Designer Collection
- Winston Plan at Brighton Knoll - Designer Collection
- Wyatt Plan at Brighton Knoll - Designer Collection
- Charles Plan at Brighton Knoll - Designer Collection
- Blair Plan at Brighton Knoll - Designer Collection
- Calvin Plan at Brighton Knoll - Designer Collection
- Grandin Plan at Brighton Knoll - Designer Collection
- Avery Plan at Brighton Knoll - Designer Collection
- Carrington Plan at Brighton Knoll - Designer Collection
- 1217 Lucca Dr
- 1566 Valdarno Dr
- 1760 Saratoga Dr
- 1626 Woodfield Dr
- 1680 Woodfield Dr
- 1509 Old Thicket Ct
- 952 Apryl Dr
- 1181 Carlton Ct
- 1196 Vestman Ct
- 1189 Carlton Ct
- 1190 Vestman Ct
- 1179 Carlton Ct
- 1184 Vestman Ct
- 1192 Carlton Ct
- 1163 Everton Ct
- 1178 Vestman Ct
- 1186 Carlton Ct
- 1208 Vestman Ct
- 1168 Everton Ct
- 1176 Clearwell Dr
- 1164 Clearwell Dr
- 1197 Vestman Ct
- 1152 Clearwell Dr
- 1191 Vestman Ct
- 1203 Vestman Ct
- 1185 Vestman Ct