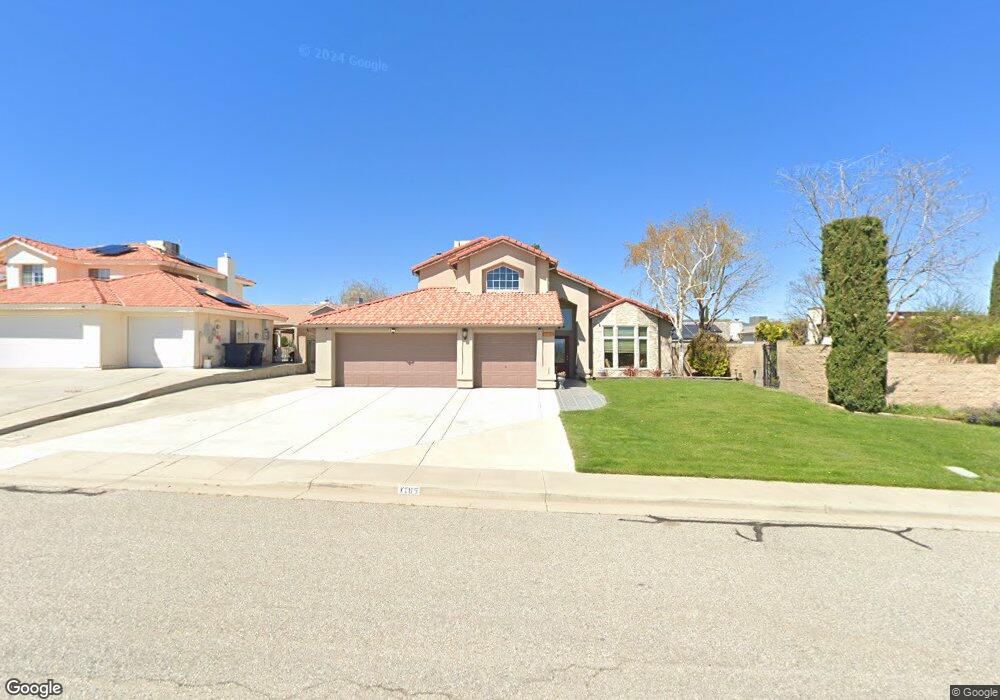
1185 Fig Dr Tehachapi, CA 93561
Estimated Value: $401,000 - $482,000
3
Beds
3
Baths
1,034
Sq Ft
$445/Sq Ft
Est. Value
About This Home
This home is located at 1185 Fig Dr, Tehachapi, CA 93561 and is currently estimated at $459,670, approximately $444 per square foot. 1185 Fig Dr is a home located in Kern County with nearby schools including Tompkins Elementary School, Jacobsen Middle School, and Tehachapi High School.
Ownership History
Date
Name
Owned For
Owner Type
Purchase Details
Closed on
Mar 12, 2012
Sold by
Singer Timothy J
Bought by
Singer Melanie G
Current Estimated Value
Create a Home Valuation Report for This Property
The Home Valuation Report is an in-depth analysis detailing your home's value as well as a comparison with similar homes in the area
Home Values in the Area
Average Home Value in this Area
Purchase History
| Date | Buyer | Sale Price | Title Company |
|---|---|---|---|
| Singer Melanie G | -- | None Available |
Source: Public Records
Tax History
| Year | Tax Paid | Tax Assessment Tax Assessment Total Assessment is a certain percentage of the fair market value that is determined by local assessors to be the total taxable value of land and additions on the property. | Land | Improvement |
|---|---|---|---|---|
| 2025 | $2,908 | $246,631 | $38,887 | $207,744 |
| 2024 | $2,802 | $241,796 | $38,125 | $203,671 |
| 2023 | $2,802 | $237,056 | $37,378 | $199,678 |
| 2022 | $2,772 | $232,410 | $36,646 | $195,764 |
| 2021 | $2,733 | $227,854 | $35,928 | $191,926 |
| 2020 | $2,739 | $225,519 | $35,560 | $189,959 |
| 2019 | $2,737 | $225,519 | $35,560 | $189,959 |
| 2018 | $2,639 | $216,764 | $34,180 | $182,584 |
| 2017 | $2,634 | $212,515 | $33,510 | $179,005 |
| 2016 | $2,562 | $208,349 | $32,853 | $175,496 |
| 2015 | $2,437 | $205,220 | $32,360 | $172,860 |
| 2014 | $2,409 | $201,202 | $31,727 | $169,475 |
Source: Public Records
Map
Nearby Homes
- 1162 Redwood Ct
- 1173 Redwood Ct
- 1306 Miranda Ct
- 1332 Cellini Ct
- 212 Artina Ct
- 219 Artina Ct
- 0 Applewood Dr
- 1309 Clasico Dr
- 906 Mulberry St
- 210 Pinon St Unit 11
- 210 Pinon St Unit 18
- 210 Pinon St Unit 4
- 210 Pinon St Unit 1
- 210 Pinon St Unit 6
- 210 Pinon St Unit 15
- 210 Pinon St Unit 5
- 210 Pinon St Unit 9
- 210 Pinon St Unit 7
- 210 Pinon St Unit 13
- 210 Pinon St Unit 8
Your Personal Tour Guide
Ask me questions while you tour the home.