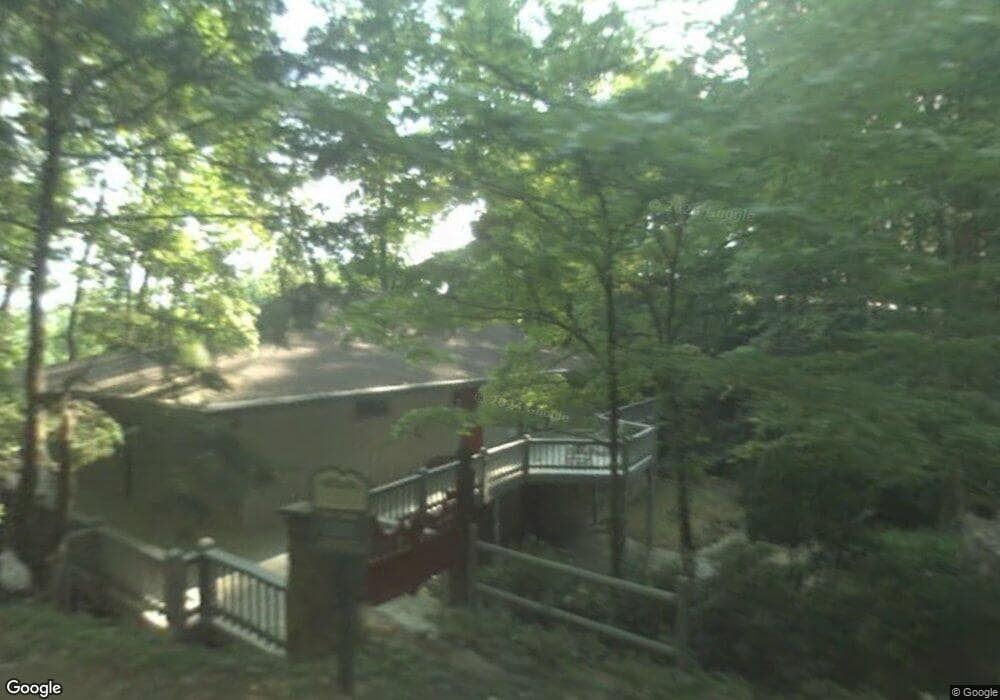
1185 Kingwood Dr Clayton, GA 30525
Estimated Value: $542,000 - $783,000
3
Beds
3
Baths
2,996
Sq Ft
$203/Sq Ft
Est. Value
About This Home
This home is located at 1185 Kingwood Dr, Clayton, GA 30525 and is currently estimated at $608,048, approximately $202 per square foot. 1185 Kingwood Dr is a home located in Rabun County with nearby schools including Rabun County Primary School and Rabun County High School.
Ownership History
Date
Name
Owned For
Owner Type
Purchase Details
Closed on
Apr 2, 2025
Sold by
Moorefield Shelley E
Bought by
Parker Ashley M and Moorefield Robert P
Current Estimated Value
Purchase Details
Closed on
Jan 11, 2018
Sold by
Kenneth Swofford E
Bought by
Moorefield Shelley E and Moorefield Robert P
Purchase Details
Closed on
Dec 14, 2017
Sold by
Regions Bank
Bought by
Hue Rainey W and Rainey Jane L
Purchase Details
Closed on
Jan 29, 2010
Sold by
The Bank Of New York Mello
Bought by
Swofford E Kenneth
Purchase Details
Closed on
Apr 12, 2005
Sold by
Rainey W Hue
Bought by
Zinney Jill
Home Financials for this Owner
Home Financials are based on the most recent Mortgage that was taken out on this home.
Original Mortgage
$348,000
Interest Rate
5.88%
Mortgage Type
New Conventional
Purchase Details
Closed on
Jul 1, 2000
Purchase Details
Closed on
Jul 1, 1999
Purchase Details
Closed on
May 1, 1998
Purchase Details
Closed on
Aug 1, 1988
Create a Home Valuation Report for This Property
The Home Valuation Report is an in-depth analysis detailing your home's value as well as a comparison with similar homes in the area
Home Values in the Area
Average Home Value in this Area
Purchase History
| Date | Buyer | Sale Price | Title Company |
|---|---|---|---|
| Parker Ashley M | -- | -- | |
| Moorefield Shelley E | $317,500 | -- | |
| Moorefield Shelley E | $317,500 | -- | |
| Hue Rainey W | -- | -- | |
| Hue Rainey W | -- | -- | |
| Swofford E Kenneth | $155,000 | -- | |
| Swofford E Kenneth | $155,000 | -- | |
| Swofford E Kenneth | $155,000 | -- | |
| Zinney Jill | $435,000 | -- | |
| Zinney Jill | $435,000 | -- | |
| -- | $395,000 | -- | |
| -- | $395,000 | -- | |
| -- | $200,000 | -- | |
| -- | $200,000 | -- | |
| -- | $159,900 | -- | |
| -- | $159,900 | -- | |
| -- | $125,000 | -- | |
| -- | $125,000 | -- |
Source: Public Records
Mortgage History
| Date | Status | Borrower | Loan Amount |
|---|---|---|---|
| Previous Owner | Zinney Jill | $348,000 |
Source: Public Records
Tax History Compared to Growth
Tax History
| Year | Tax Paid | Tax Assessment Tax Assessment Total Assessment is a certain percentage of the fair market value that is determined by local assessors to be the total taxable value of land and additions on the property. | Land | Improvement |
|---|---|---|---|---|
| 2025 | $2,597 | $161,809 | $24,000 | $137,809 |
| 2024 | $2,487 | $154,964 | $24,000 | $130,964 |
| 2023 | $2,477 | $135,324 | $24,000 | $111,324 |
| 2022 | $2,409 | $131,603 | $24,000 | $107,603 |
| 2021 | $2,242 | $119,572 | $24,000 | $95,572 |
| 2020 | $2,281 | $117,587 | $24,000 | $93,587 |
| 2019 | $2,297 | $117,587 | $24,000 | $93,587 |
| 2018 | $2,152 | $109,788 | $24,000 | $85,788 |
| 2017 | $1,803 | $95,930 | $28,800 | $67,130 |
| 2016 | $1,808 | $95,930 | $28,800 | $67,130 |
| 2015 | $1,939 | $100,665 | $28,800 | $71,865 |
| 2014 | $1,964 | $101,472 | $28,800 | $72,672 |
Source: Public Records
Map
Nearby Homes
- 0 Kingwood Dr Unit LOT 104CC 10359599
- 0 Kingwood Dr Unit 10607215
- 112 Gleneagle Ct Unit D202
- 0 Kingwood Court Ln Unit 10628599
- 0 Kingwood Court Ln Unit 10652104
- 251 Shakespeare Dr Unit 321
- 251 Shakespeare Dr Unit 332
- 10 Quiet Place Ln
- 20 Gleneagle Ct Unit BUILDING A UNIT 102
- 20 Gleneagle Ct Unit 303A
- 0 Brown Hawk Unit 10495084
- 0 Brown Hawk Unit 7555224
- LOT 16 Brown Hawk Dr
- 52 Breton Highlands Ct
- Eastview Eastview Lane- Lot M
- 300 Banister Dr Unit 201
- 300 Banister Dr Unit 303
- 0 King Mtn Dr Unit 10203369
- 0 Wood Sorrel Ln Unit LOT 727/726
- 0 Wood Sorrel Ln Unit 7665794
- 1185 Kingwood Dr Unit 17
- 103 Kingwood Dr Unit MM
- 106 Kingwood Dr Unit MM
- 100 Kingwood Dr Unit GG
- 146 Kingwood Dr Unit OVERLOOK
- 146 Kingwood Dr Unit OVLK
- 152 Kingwood Dr
- 152 Kingwood Dr Unit 108
- 164 Kingwood Dr Unit OVERLOOK
- 164 Kingwood Dr Unit OVLK
- 47 Hidden Waters Ln
- 47 Hidden Waters Ln Unit Lot 36
- 47 Hidden Waters Ln Unit 47 & 36
- 1380 Kingwood Dr
- 1380 Kingwood Dr Unit 41F
- 64 Hidden Waters Ln
- 73 Lancelot Loop
- 1322 Kingwood Dr
- 101 Lancelot Loop
- 15 Hidden Waters Ln