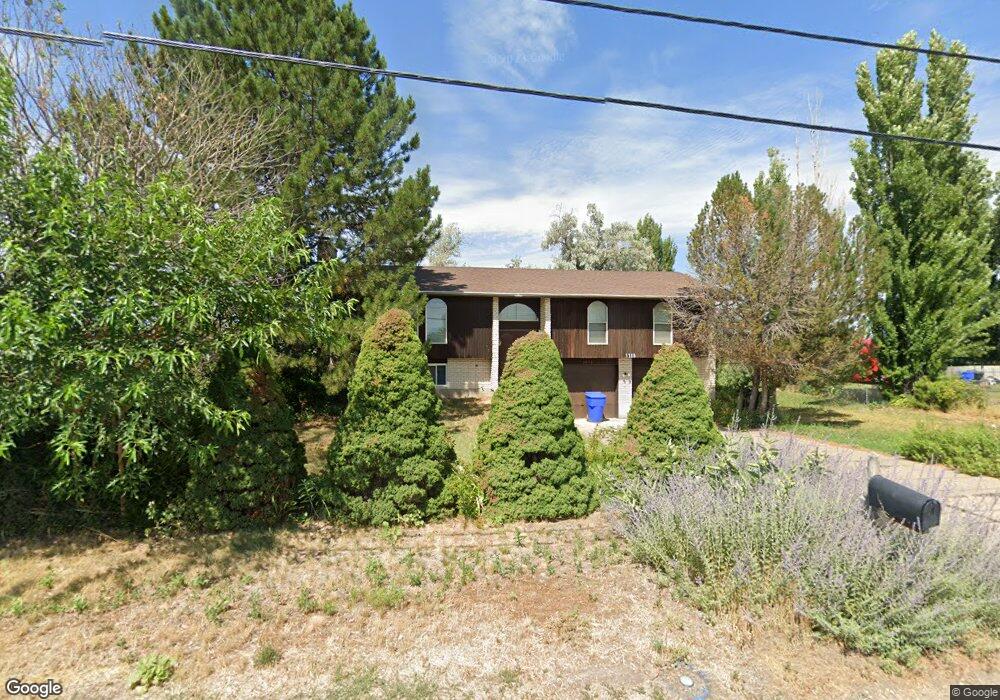
1185 N 4500 W Clearfield, UT 84015
Estimated Value: $518,000 - $576,000
4
Beds
3
Baths
2,527
Sq Ft
$221/Sq Ft
Est. Value
About This Home
This home is located at 1185 N 4500 W, Clearfield, UT 84015 and is currently estimated at $557,287, approximately $220 per square foot. 1185 N 4500 W is a home located in Davis County with nearby schools including West Point School, West Point Junior High School, and Syracuse High School.
Ownership History
Date
Name
Owned For
Owner Type
Purchase Details
Closed on
Oct 11, 2023
Sold by
Farb Jesse and Farb Maria
Bought by
Ramirez Jose Humberto Lun and Vega Christian Alejandro
Current Estimated Value
Home Financials for this Owner
Home Financials are based on the most recent Mortgage that was taken out on this home.
Original Mortgage
$424,375
Outstanding Balance
$414,571
Interest Rate
6.5%
Mortgage Type
New Conventional
Estimated Equity
$142,716
Purchase Details
Closed on
Jul 21, 2011
Sold by
Garner Larry Nolan and Garner Susan M
Bought by
Farb Jesse and Farb Maria
Home Financials for this Owner
Home Financials are based on the most recent Mortgage that was taken out on this home.
Original Mortgage
$170,690
Interest Rate
4.25%
Mortgage Type
FHA
Purchase Details
Closed on
Dec 16, 2000
Sold by
Garner Larry Nolan
Bought by
Garner Larry Nolan and Garner Susan M
Home Financials for this Owner
Home Financials are based on the most recent Mortgage that was taken out on this home.
Original Mortgage
$135,875
Interest Rate
7.81%
Create a Home Valuation Report for This Property
The Home Valuation Report is an in-depth analysis detailing your home's value as well as a comparison with similar homes in the area
Home Values in the Area
Average Home Value in this Area
Purchase History
| Date | Buyer | Sale Price | Title Company |
|---|---|---|---|
| Ramirez Jose Humberto Lun | -- | Us Title | |
| Ramirez Jose Humberto Lun | -- | Us Title | |
| Farb Jesse | -- | Atlas Title Murray | |
| Garner Larry Nolan | -- | Home Abst & Title Co |
Source: Public Records
Mortgage History
| Date | Status | Borrower | Loan Amount |
|---|---|---|---|
| Open | Ramirez Jose Humberto Lun | $424,375 | |
| Closed | Ramirez Jose Humberto Lun | $424,375 | |
| Previous Owner | Farb Jesse | $170,690 | |
| Previous Owner | Garner Larry Nolan | $135,875 |
Source: Public Records
Tax History
| Year | Tax Paid | Tax Assessment Tax Assessment Total Assessment is a certain percentage of the fair market value that is determined by local assessors to be the total taxable value of land and additions on the property. | Land | Improvement |
|---|---|---|---|---|
| 2025 | $2,910 | $267,850 | $112,103 | $155,747 |
| 2024 | $2,898 | $267,850 | $143,893 | $123,957 |
| 2023 | $2,584 | $439,000 | $197,479 | $241,521 |
| 2022 | $2,760 | $256,850 | $108,160 | $148,690 |
| 2021 | $2,487 | $346,000 | $148,695 | $197,305 |
| 2020 | $2,197 | $301,000 | $128,436 | $172,564 |
| 2019 | $2,193 | $296,000 | $123,549 | $172,451 |
| 2018 | $2,009 | $267,000 | $116,020 | $150,980 |
| 2016 | $1,638 | $114,180 | $45,213 | $68,967 |
| 2015 | $1,594 | $105,325 | $45,213 | $60,112 |
| 2014 | $1,692 | $113,091 | $45,213 | $67,878 |
| 2013 | -- | $106,602 | $38,538 | $68,064 |
Source: Public Records
Map
Nearby Homes
- 4719 W 650 N
- 1156 N 5150 W
- 3721 W 825 N Unit 101
- 4901 W 650 N
- 774 N 4000 W
- 477 N 4500 W
- 4396 W 1825 N Unit 112
- 4382 W 1825 N Unit 110
- 4348 W 1825 N Unit 103
- 2084 N 4500 W
- 128 N 4500 W
- 3667 W 520 N
- 4594 W 75 N Unit 405
- 120 N 4325 W
- 4362 West St Unit 106
- 4358 West St Unit 105
- 4669 W 75 N
- 3656 W 1800 N
- 704 N 3500 W
- 113 N 4950 W
Your Personal Tour Guide
Ask me questions while you tour the home.