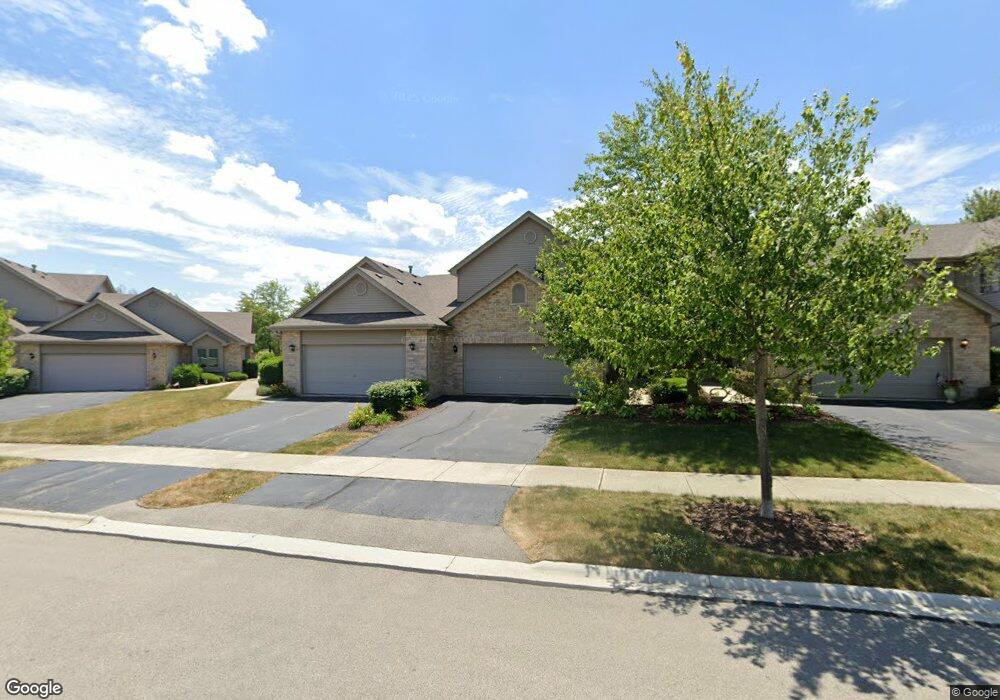
11851 Somerset Rd Unit 1185 Orland Park, IL 60467
Orland Grove NeighborhoodEstimated Value: $388,000 - $435,000
3
Beds
3
Baths
2,321
Sq Ft
$177/Sq Ft
Est. Value
About This Home
This home is located at 11851 Somerset Rd Unit 1185, Orland Park, IL 60467 and is currently estimated at $410,221, approximately $176 per square foot. 11851 Somerset Rd Unit 1185 is a home located in Cook County with nearby schools including Orland Park Elementary School, High Point Elementary School, and Orland Jr High School.
Ownership History
Date
Name
Owned For
Owner Type
Purchase Details
Closed on
Nov 13, 2023
Sold by
Begermi Ahmed Sharif and Begermi Jane S
Bought by
Begermi Jane S
Current Estimated Value
Purchase Details
Closed on
Jun 20, 2019
Sold by
San Gabriel Barnard D San and San Gabriel Emelita A
Bought by
Begermi A Sharif and Begermi Jane S
Purchase Details
Closed on
Apr 18, 2008
Sold by
Munro Thomas V
Bought by
San Gabriel Barnard and San Gabriel Emelita
Home Financials for this Owner
Home Financials are based on the most recent Mortgage that was taken out on this home.
Original Mortgage
$308,443
Interest Rate
6.17%
Mortgage Type
FHA
Purchase Details
Closed on
Apr 27, 2006
Sold by
Scheel Todd J and Koch Danielle M
Bought by
Munro Tom
Home Financials for this Owner
Home Financials are based on the most recent Mortgage that was taken out on this home.
Original Mortgage
$256,000
Interest Rate
6.39%
Mortgage Type
Fannie Mae Freddie Mac
Create a Home Valuation Report for This Property
The Home Valuation Report is an in-depth analysis detailing your home's value as well as a comparison with similar homes in the area
Home Values in the Area
Average Home Value in this Area
Purchase History
| Date | Buyer | Sale Price | Title Company |
|---|---|---|---|
| Begermi Jane S | -- | None Listed On Document | |
| Begermi A Sharif | $258,000 | Attorneys Ttl Guaranty Fund | |
| San Gabriel Barnard | $313,000 | Pntn | |
| Munro Tom | $320,000 | Stewart Title Of Illinois |
Source: Public Records
Mortgage History
| Date | Status | Borrower | Loan Amount |
|---|---|---|---|
| Previous Owner | San Gabriel Barnard | $308,443 | |
| Previous Owner | Munro Tom | $256,000 |
Source: Public Records
Tax History Compared to Growth
Tax History
| Year | Tax Paid | Tax Assessment Tax Assessment Total Assessment is a certain percentage of the fair market value that is determined by local assessors to be the total taxable value of land and additions on the property. | Land | Improvement |
|---|---|---|---|---|
| 2024 | $7,516 | $36,000 | $2,625 | $33,375 |
| 2023 | $5,542 | $36,000 | $2,625 | $33,375 |
| 2022 | $5,542 | $25,342 | $2,310 | $23,032 |
| 2021 | $5,404 | $25,341 | $2,310 | $23,031 |
| 2020 | $7,057 | $25,341 | $2,310 | $23,031 |
| 2019 | $7,955 | $28,981 | $2,100 | $26,881 |
| 2018 | $7,737 | $28,981 | $2,100 | $26,881 |
| 2017 | $7,562 | $28,981 | $2,100 | $26,881 |
| 2016 | $6,927 | $24,825 | $1,890 | $22,935 |
| 2015 | $6,860 | $24,825 | $1,890 | $22,935 |
| 2014 | $6,930 | $25,454 | $1,890 | $23,564 |
| 2013 | $5,629 | $21,961 | $1,890 | $20,071 |
Source: Public Records
Map
Nearby Homes
- 11901 Somerset Rd Unit 2
- 11851 Windemere Ct Unit 201
- 11901 Windemere Ct Unit 301
- 14328 Pinewood Dr
- 11501 W 143rd St
- 14405 Creekwood Dr
- 11637 Brookview Ln
- 11811 Old Spanish Trail
- 14225 Mallard Dr
- 11701 Waters Edge Trail
- 13951 Green Valley Dr
- 11708 139th St
- 13910 Green Valley Dr
- 14467 Creekview Dr
- 13766 Mccabe Dr
- 12009 Venetian Way
- 13810 Logan Dr
- 12360 Derby Ln
- 13650 Old Post Rd
- 14042 Churchill Dr
- 11851 Somerset Rd
- 11853 Somerset Rd Unit 1
- 11855 Somerset Rd
- 11843 Somerset Rd
- 11857 Somerset Rd
- 11841 Somerset Rd
- 11839 Somerset Rd
- 11840 Somerset Rd
- 11851 Windemere Ct Unit 11851
- 11851 Windemere Ct Unit 11851
- 11851 Windemere Ct Unit 11851
- 11851 Windemere Ct Unit 11851
- 11851 Windemere Ct Unit 11851
- 11851 Windemere Ct Unit 11851
- 11851 Windemere Ct Unit 11851
- 11851 Windemere Ct Unit 11851
- 11851 Windemere Ct Unit 11851
- 11851 Windemere Ct Unit 11851
- 11851 Windemere Ct Unit 11851
- 11851 Windemere Ct Unit 11851