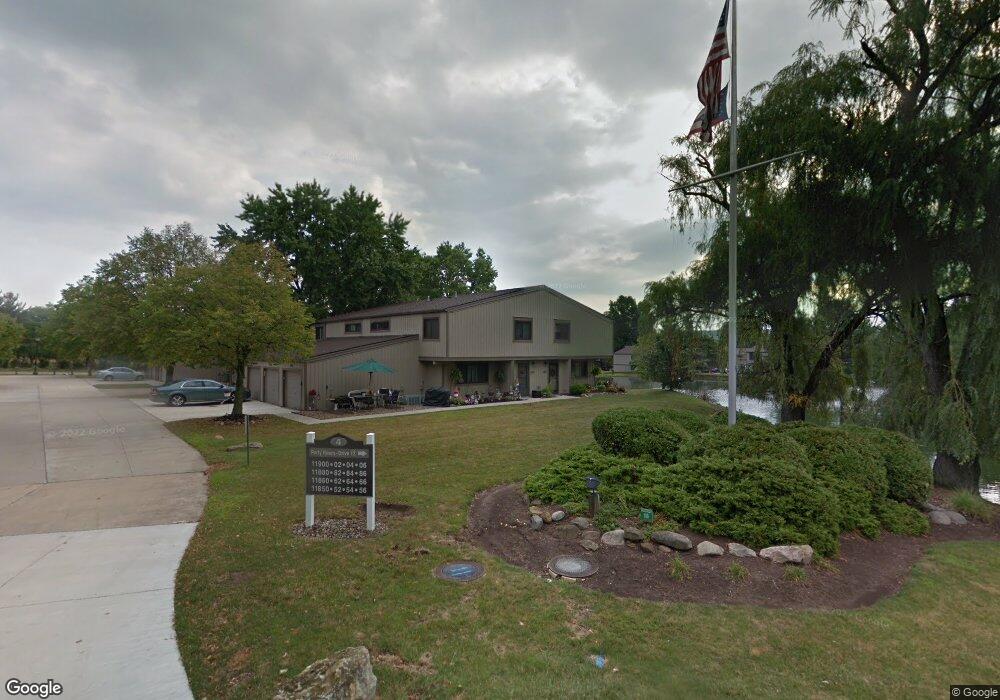
11852 Harbour Light Dr Unit 1852 North Royalton, OH 44133
Estimated Value: $172,000 - $185,000
3
Beds
2
Baths
1,342
Sq Ft
$133/Sq Ft
Est. Value
About This Home
This home is located at 11852 Harbour Light Dr Unit 1852, North Royalton, OH 44133 and is currently estimated at $178,333, approximately $132 per square foot. 11852 Harbour Light Dr Unit 1852 is a home located in Cuyahoga County with nearby schools including North Royalton Middle School, North Royalton High School, and Royal Redeemer Lutheran School.
Ownership History
Date
Name
Owned For
Owner Type
Purchase Details
Closed on
Aug 13, 2010
Sold by
Fannie Mae
Bought by
Mamone Paula
Current Estimated Value
Purchase Details
Closed on
Jun 2, 2010
Sold by
Buettner John P
Bought by
Federal National Mortgage Association
Purchase Details
Closed on
Mar 22, 1999
Sold by
Ritchie David J
Bought by
Buettner John P and Buettner Karen L
Home Financials for this Owner
Home Financials are based on the most recent Mortgage that was taken out on this home.
Original Mortgage
$77,900
Interest Rate
6.94%
Purchase Details
Closed on
May 6, 1986
Sold by
Ritchie David J and Ritchie Carol A
Bought by
Ritchie David J
Purchase Details
Closed on
Nov 7, 1975
Sold by
Ritchie David J and C A
Bought by
Ritchie David J and Ritchie Carol A
Purchase Details
Closed on
Jan 1, 1975
Bought by
Ritchie David J and C A
Create a Home Valuation Report for This Property
The Home Valuation Report is an in-depth analysis detailing your home's value as well as a comparison with similar homes in the area
Home Values in the Area
Average Home Value in this Area
Purchase History
| Date | Buyer | Sale Price | Title Company |
|---|---|---|---|
| Mamone Paula | $60,000 | Accutitle Agency | |
| Federal National Mortgage Association | $50,000 | None Available | |
| Buettner John P | $82,000 | Resource Title Agency Inc | |
| Ritchie David J | -- | -- | |
| Ritchie David J | -- | -- | |
| Ritchie David J | -- | -- |
Source: Public Records
Mortgage History
| Date | Status | Borrower | Loan Amount |
|---|---|---|---|
| Previous Owner | Buettner John P | $77,900 | |
| Closed | Buettner John P | $77,900 |
Source: Public Records
Tax History Compared to Growth
Tax History
| Year | Tax Paid | Tax Assessment Tax Assessment Total Assessment is a certain percentage of the fair market value that is determined by local assessors to be the total taxable value of land and additions on the property. | Land | Improvement |
|---|---|---|---|---|
| 2024 | $2,844 | $48,965 | $4,900 | $44,065 |
| 2023 | $2,184 | $34,480 | $3,470 | $31,010 |
| 2022 | $2,169 | $34,480 | $3,470 | $31,010 |
| 2021 | $1,636 | $34,480 | $3,470 | $31,010 |
| 2020 | $1,747 | $26,110 | $2,630 | $23,490 |
| 2019 | $1,696 | $74,600 | $7,500 | $67,100 |
| 2018 | $1,714 | $26,110 | $2,630 | $23,490 |
| 2017 | $1,412 | $16,800 | $2,590 | $14,210 |
| 2016 | $1,351 | $16,800 | $2,590 | $14,210 |
| 2015 | $4,138 | $16,800 | $2,590 | $14,210 |
| 2014 | $4,138 | $21,010 | $3,260 | $17,750 |
Source: Public Records
Map
Nearby Homes
- 11806 Harbour Light Dr Unit 1806
- 11650 Harbour Light Dr Unit 1650
- 11445 Harbour Light Dr
- 10700 Abbey Rd
- 9821 Sunrise Blvd Unit o1
- 10560 Independence Dr Unit 25A
- 9800 Cove Dr Unit H2
- 9761 Sunrise Blvd
- 10364 Independence Dr Unit 19c
- 10342 Independence Dr Unit 21B
- 9710 Cove Dr Unit 23G
- 9660 Cove Dr Unit F13
- 9938 Abbey Rd
- 9630 Cove Dr Unit A-14
- 10641 Albion Rd
- 9611 Sunrise Blvd Unit K2
- 9530 Cove Dr Unit C-25
- 9510 Cove Dr Unit C12
- 11550 York Rd
- 12664 W 130th St
- 11856 Harbour Light Dr Unit 1856
- 11850 Harbour Light Dr
- 11854 Harbour Light Dr
- 11886 Harbour Light Dr Unit 1886
- 11884 Harbour Light Dr Unit 1884
- 11880 Harbour Light Dr Unit 1880
- 11882 Harbour Light Dr
- 11882 Harbour Light Dr Unit 182
- 11884 Harbour Light Dr Unit 15-188
- 11886 Harbour Light Dr Unit 15-188
- 11864 Harbour Light Dr Unit 1864
- 11866 Harbour Light Dr Unit 1866
- 11860 Harbour Light Dr
- 11862 Harbour Light Dr
- 11864 Harbour Light Dr Unit 16-186
- 11904 Harbour Light Dr Unit 1904
- 11902 Harbour Light Dr Unit 1902
- 11906 Harbour Light Dr Unit 1906
- 11900 Harbour Light Dr
- 11919 Harbour Light Dr Unit 1919