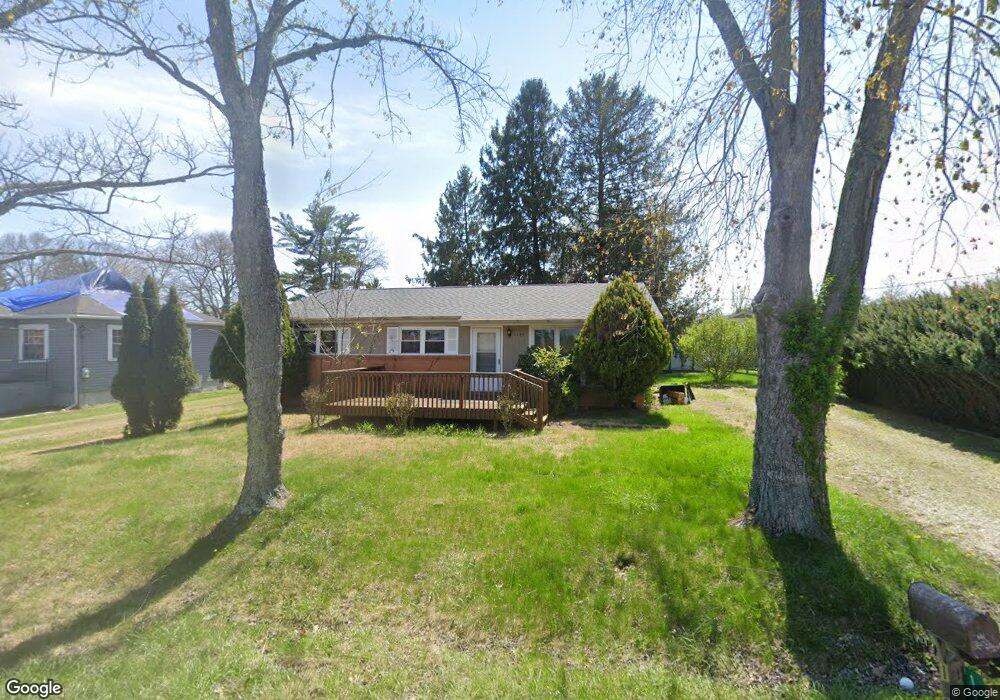
1186 Beverly Ave Zanesville, OH 43701
Estimated Value: $193,000 - $223,000
3
Beds
1
Bath
1,040
Sq Ft
$201/Sq Ft
Est. Value
About This Home
This home is located at 1186 Beverly Ave, Zanesville, OH 43701 and is currently estimated at $209,070, approximately $201 per square foot. 1186 Beverly Ave is a home located in Muskingum County with nearby schools including John McIntire Elementary School, Zanesville Middle School, and Zanesville High School.
Ownership History
Date
Name
Owned For
Owner Type
Purchase Details
Closed on
Apr 28, 2011
Sold by
Fannie Mae
Bought by
Gm Management Llc
Current Estimated Value
Purchase Details
Closed on
Mar 23, 2011
Sold by
Jones Regina K and Aurora Loan Services Llc
Bought by
Federal National Mortgage Association
Purchase Details
Closed on
Aug 3, 2001
Sold by
Magyar Kenneth D
Bought by
Jones Regina K and Glosser Terrie L
Home Financials for this Owner
Home Financials are based on the most recent Mortgage that was taken out on this home.
Original Mortgage
$83,836
Interest Rate
7.14%
Mortgage Type
FHA
Purchase Details
Closed on
Aug 5, 1997
Sold by
Barnett Rosa
Bought by
Magyar Kenneth D
Home Financials for this Owner
Home Financials are based on the most recent Mortgage that was taken out on this home.
Original Mortgage
$50,000
Interest Rate
7.71%
Mortgage Type
New Conventional
Create a Home Valuation Report for This Property
The Home Valuation Report is an in-depth analysis detailing your home's value as well as a comparison with similar homes in the area
Home Values in the Area
Average Home Value in this Area
Purchase History
| Date | Buyer | Sale Price | Title Company |
|---|---|---|---|
| Gm Management Llc | $54,900 | None Available | |
| Gm Management Llc | $54,900 | None Available | |
| Federal National Mortgage Association | $50,000 | None Available | |
| Jones Regina K | $84,500 | -- | |
| Magyar Kenneth D | $62,500 | -- |
Source: Public Records
Mortgage History
| Date | Status | Borrower | Loan Amount |
|---|---|---|---|
| Previous Owner | Jones Regina K | $83,836 | |
| Previous Owner | Magyar Kenneth D | $50,000 |
Source: Public Records
Tax History Compared to Growth
Tax History
| Year | Tax Paid | Tax Assessment Tax Assessment Total Assessment is a certain percentage of the fair market value that is determined by local assessors to be the total taxable value of land and additions on the property. | Land | Improvement |
|---|---|---|---|---|
| 2024 | $1,824 | $48,895 | $6,230 | $42,665 |
| 2023 | $1,326 | $33,250 | $3,255 | $29,995 |
| 2022 | $1,265 | $32,305 | $3,255 | $29,050 |
| 2021 | $1,254 | $32,305 | $3,255 | $29,050 |
| 2020 | $1,120 | $28,105 | $2,835 | $25,270 |
| 2019 | $1,120 | $28,105 | $2,835 | $25,270 |
| 2018 | $1,108 | $28,105 | $2,835 | $25,270 |
| 2017 | $1,061 | $25,200 | $2,835 | $22,365 |
| 2016 | $1,076 | $25,210 | $2,840 | $22,370 |
| 2015 | $1,079 | $25,210 | $2,840 | $22,370 |
| 2013 | $1,199 | $25,210 | $2,840 | $22,370 |
Source: Public Records
Map
Nearby Homes
- 1208 Brandywine Blvd
- 1106 S Slope Bay
- 830 Bethesda Dr Unit 4
- 835 Princeton Ave
- 0 Colony Park Ct
- 0 Leonard Ave Unit 4200634
- 1570 Nob Hill Rd
- 610 Military Rd
- 600 Military Rd
- 801 Leonard Ave
- 2370 Oak Meadow Ln
- 1121 Chatham Dr Unit 1121
- 753 Leonard Ave
- 1136 Chatham Dr
- 765 Wabash Ave
- 0 W Ray- 36c Dr
- 0 W Ray Dr
- 36C W Ray Dr
- 3245 Circle Ct
- 3095 E Winding Way
- 3042 Fairway Ln
- 1174 Beverly Ave
- 3040 Fairway Ln
- 3036 Fairway Ln
- 1150 Beverly Ave
- 3030 Fairway Ln
- 1180 Military Rd
- 1166 Military Rd
- 1166 Military Rd Unit A
- 1166 Military Rd Unit B1
- 1166 Military Rd Unit A
- 1144 Beverly Ave
- 3022 Fairway Ln
- 1159 Country Club Dr
- 1149 Country Club Dr
- 1126 Beverly Ave
- 1161 Country Club Dr
- 1139 Country Club Dr
- 1118 Beverly Ave
- 1177 Military Rd