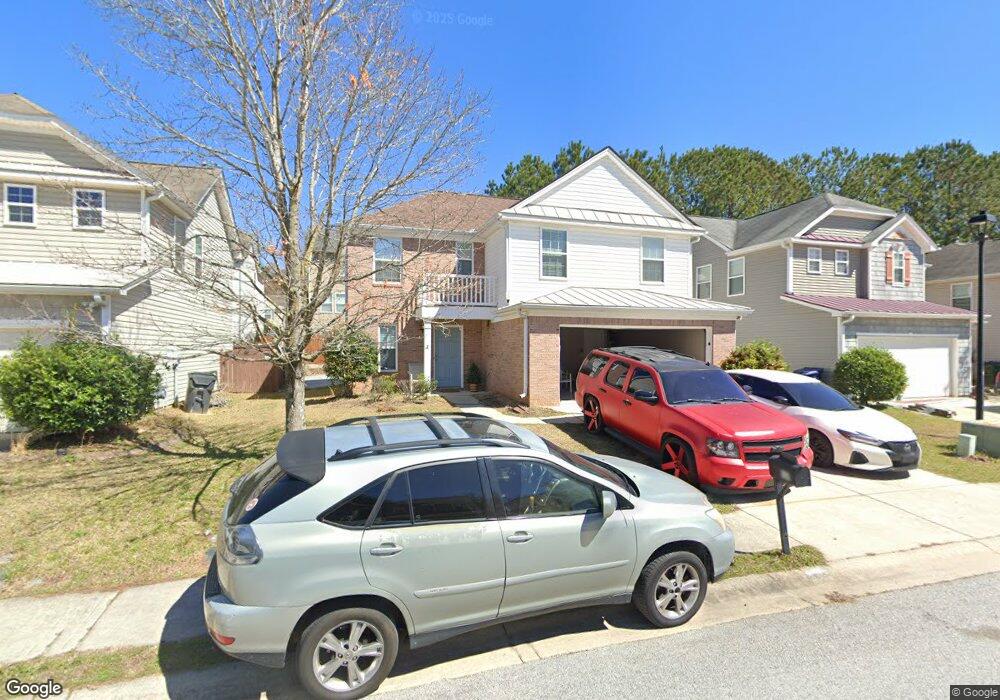
1186 Matt Moore Ct Lithia Springs, GA 30122
Lithia Springs NeighborhoodEstimated Value: $298,821 - $322,000
3
Beds
3
Baths
1,669
Sq Ft
$188/Sq Ft
Est. Value
About This Home
This home is located at 1186 Matt Moore Ct, Lithia Springs, GA 30122 and is currently estimated at $313,205, approximately $187 per square foot. 1186 Matt Moore Ct is a home located in Douglas County with nearby schools including Lithia Springs Elementary School, Turner Middle School, and Lithia Springs Comprehensive High School.
Ownership History
Date
Name
Owned For
Owner Type
Purchase Details
Closed on
Oct 25, 2021
Sold by
Opendoor Property Trust I
Bought by
Sfr Jv 2 Property Llc
Current Estimated Value
Purchase Details
Closed on
Sep 24, 2021
Sold by
Nero June K
Bought by
Opendoor Property Trust I
Purchase Details
Closed on
Jul 28, 2021
Sold by
Hughes Michael S
Bought by
Opt Nd Oar Property Trust
Purchase Details
Closed on
Jul 1, 2004
Sold by
Colony Homes Llc
Bought by
Nero June K
Home Financials for this Owner
Home Financials are based on the most recent Mortgage that was taken out on this home.
Original Mortgage
$137,570
Interest Rate
6.25%
Mortgage Type
VA
Create a Home Valuation Report for This Property
The Home Valuation Report is an in-depth analysis detailing your home's value as well as a comparison with similar homes in the area
Home Values in the Area
Average Home Value in this Area
Purchase History
| Date | Buyer | Sale Price | Title Company |
|---|---|---|---|
| Sfr Jv 2 Property Llc | $275,000 | -- | |
| Opendoor Property Trust I | $246,400 | -- | |
| Opt Nd Oar Property Trust | $218,400 | None Listed On Document | |
| Nero June K | $147,600 | -- |
Source: Public Records
Mortgage History
| Date | Status | Borrower | Loan Amount |
|---|---|---|---|
| Previous Owner | Nero June K | $137,570 |
Source: Public Records
Tax History Compared to Growth
Tax History
| Year | Tax Paid | Tax Assessment Tax Assessment Total Assessment is a certain percentage of the fair market value that is determined by local assessors to be the total taxable value of land and additions on the property. | Land | Improvement |
|---|---|---|---|---|
| 2024 | $3,842 | $120,040 | $24,960 | $95,080 |
| 2023 | $3,842 | $120,040 | $24,960 | $95,080 |
| 2022 | $3,363 | $101,280 | $21,280 | $80,000 |
| 2021 | $1,830 | $60,200 | $12,120 | $48,080 |
| 2020 | $1,854 | $60,200 | $12,120 | $48,080 |
| 2019 | $1,711 | $58,280 | $12,120 | $46,160 |
| 2018 | $1,511 | $50,000 | $10,640 | $39,360 |
| 2017 | $1,389 | $45,320 | $10,640 | $34,680 |
| 2016 | $1,330 | $42,800 | $10,520 | $32,280 |
| 2015 | $978 | $36,560 | $9,280 | $27,280 |
| 2014 | $978 | $30,800 | $8,160 | $22,640 |
| 2013 | -- | $30,200 | $8,040 | $22,160 |
Source: Public Records
Map
Nearby Homes
- 0 Vulcan Dr Unit 10471332
- 0 Vulcan Dr Unit 7530603
- 2741 Groovers Lake Point
- 2683 Jordan Ln
- 2694 Jordan Ln
- 2694 Jordan Ln Unit 23
- 2623 Jordan Ln
- 2693 Jordan Ln
- Wisteria Plan at The View at Groover's Lake - Georgian Series
- Redbud Plan at The View at Groover's Lake - Georgian Series
- Bradley Plan at The View at Groover's Lake - Georgian Series
- Bayberry Plan at The View at Groover's Lake - Georgian Series
- 0 W Lake Vulcan Dr Unit 10587241
- 6827 Chataran Dr
- 7814 Messina Ct
- 8816 Sibella Ct
- 3403 Linda Dr
- 3135 Ellenton Dr
- 3245 W Anderson Dr
- 0 Miller St Unit 10574225
- 1184 Matt Moore Ct
- 1188 Matt Moore Ct
- 1188 Matt Moore Ct Unit 121
- 1193 Andrews Dr Unit 2
- 1195 Andrews Dr
- 1182 Matt Moore Ct
- 1191 Andrews Dr Unit 2
- 1190 Matt Moore Ct
- 1197 Andrews Dr
- 1187 Matt Moore Ct
- 1189 Matt Moore Ct
- 1189 Andrews Dr
- 1185 Matt Moore Ct
- 1180 Matt Moore Ct
- 1191 Matt Moore Ct
- 1192 Matt Moore Ct
- 1199 Andrews Dr
- 1181 Matt Moore Ct
- 1193 Matt Moore Ct
- 1179 Matt Moore Ct