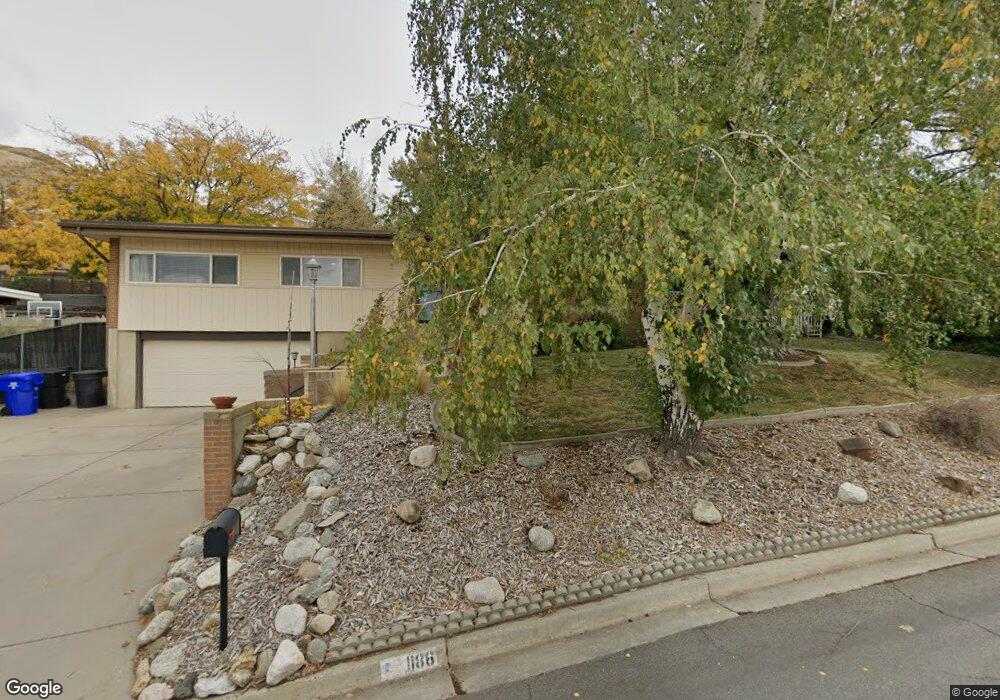
1186 N 850 E Bountiful, UT 84010
Estimated Value: $524,672 - $765,000
3
Beds
2
Baths
2,130
Sq Ft
$288/Sq Ft
Est. Value
About This Home
This home is located at 1186 N 850 E, Bountiful, UT 84010 and is currently estimated at $613,918, approximately $288 per square foot. 1186 N 850 E is a home located in Davis County with nearby schools including Tolman School, Bountiful Junior High School, and Viewmont High School.
Ownership History
Date
Name
Owned For
Owner Type
Purchase Details
Closed on
Apr 28, 2010
Sold by
Kronberger Stephan K and Coller Melissa L
Bought by
Biasutti Stefano and Biasutti Sara M
Current Estimated Value
Home Financials for this Owner
Home Financials are based on the most recent Mortgage that was taken out on this home.
Original Mortgage
$216,015
Outstanding Balance
$147,391
Interest Rate
5.5%
Mortgage Type
FHA
Estimated Equity
$466,527
Purchase Details
Closed on
Apr 24, 2007
Sold by
Kronberger Stephan K
Bought by
Kronberger Stephan K and Coller Melissa L
Purchase Details
Closed on
Dec 26, 1995
Sold by
Kronberger Stephen K and Kronberger Stephan K
Bought by
Kronberger Stephan K and Kronberger Donna Rae
Home Financials for this Owner
Home Financials are based on the most recent Mortgage that was taken out on this home.
Original Mortgage
$47,000
Interest Rate
6.87%
Create a Home Valuation Report for This Property
The Home Valuation Report is an in-depth analysis detailing your home's value as well as a comparison with similar homes in the area
Purchase History
| Date | Buyer | Sale Price | Title Company |
|---|---|---|---|
| Biasutti Stefano | -- | Backman Title Services | |
| Kronberger Stephan K | -- | None Available | |
| Kronberger Stephan K | -- | Bonneville Title Company Inc |
Source: Public Records
Mortgage History
| Date | Status | Borrower | Loan Amount |
|---|---|---|---|
| Open | Biasutti Stefano | $216,015 | |
| Previous Owner | Kronberger Stephan K | $47,000 |
Source: Public Records
Tax History
| Year | Tax Paid | Tax Assessment Tax Assessment Total Assessment is a certain percentage of the fair market value that is determined by local assessors to be the total taxable value of land and additions on the property. | Land | Improvement |
|---|---|---|---|---|
| 2025 | $3,282 | $262,900 | $128,497 | $134,403 |
| 2024 | $3,018 | $257,400 | $118,555 | $138,845 |
| 2023 | $2,918 | $450,000 | $213,898 | $236,102 |
| 2022 | $3,171 | $264,550 | $113,751 | $150,799 |
| 2021 | $2,388 | $328,000 | $168,976 | $159,024 |
| 2020 | $2,282 | $289,000 | $153,886 | $135,114 |
| 2019 | $2,209 | $284,000 | $153,963 | $130,037 |
| 2018 | $1,976 | $255,000 | $142,698 | $112,302 |
| 2016 | $1,749 | $121,440 | $45,356 | $76,084 |
| 2015 | $1,731 | $113,410 | $45,356 | $68,054 |
| 2014 | $1,730 | $116,935 | $45,356 | $71,579 |
| 2013 | -- | $110,812 | $43,945 | $66,867 |
Source: Public Records
Map
Nearby Homes
- 662 E 1200 N
- 1023 E 800 N
- 908 Northern Hills Dr Unit 3
- 933 Northern Hills Cir
- 610 E Pages Ln
- 1342 Northridge Dr
- 513 N 400 E Unit 14B
- 214 E 1250 N
- 453 N 400 E Unit 7-D
- 610 S 800 E
- 345 N 400 E
- 683 E 100 N
- 1420 N Main St
- 967 S Courtyard Ln
- 1342 E Skyline Dr N Unit 30
- 345 E 600 S
- 495 E 475 S
- 150 E 735 S Unit 23
- 17 E 400 N Unit 19B
- 96 Village Square Rd
Your Personal Tour Guide
Ask me questions while you tour the home.