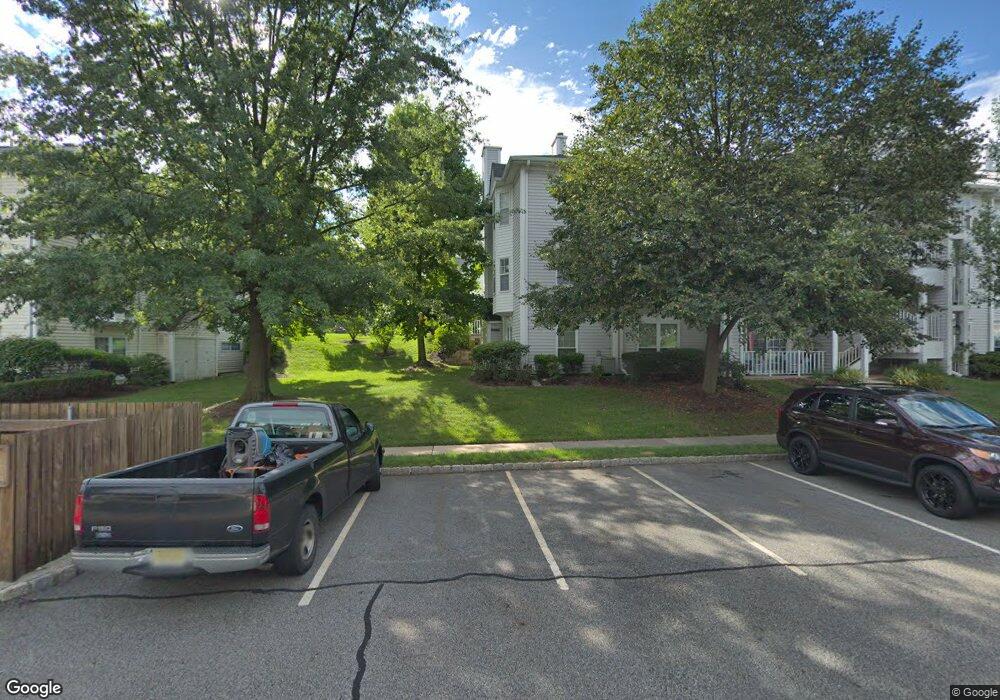
1186 Sycamore Ln Unit A2 Mahwah, NJ 07430
Estimated Value: $486,000 - $505,000
2
Beds
2
Baths
1,126
Sq Ft
$440/Sq Ft
Est. Value
About This Home
This home is located at 1186 Sycamore Ln Unit A2, Mahwah, NJ 07430 and is currently estimated at $495,559, approximately $440 per square foot. 1186 Sycamore Ln Unit A2 is a home located in Bergen County with nearby schools including Mahwah High School.
Ownership History
Date
Name
Owned For
Owner Type
Purchase Details
Closed on
Aug 22, 2024
Sold by
Delmastro Theresa
Bought by
Delmastro Christopher P
Current Estimated Value
Purchase Details
Closed on
Feb 8, 2019
Sold by
Messaros Clifford J
Bought by
Delmastro Theresa
Purchase Details
Closed on
Nov 13, 2017
Sold by
Jan Llc
Bought by
Messaros Clifford J
Purchase Details
Closed on
Oct 25, 2017
Sold by
Weiss Julie A and Prahm Julie
Bought by
Jan Llc
Purchase Details
Closed on
Aug 17, 2000
Sold by
Sprott Alisa D
Bought by
Weiss Julie A
Home Financials for this Owner
Home Financials are based on the most recent Mortgage that was taken out on this home.
Original Mortgage
$100,000
Interest Rate
8.06%
Purchase Details
Closed on
Oct 31, 1995
Sold by
Wry Nancy
Bought by
Sprott Alisa
Home Financials for this Owner
Home Financials are based on the most recent Mortgage that was taken out on this home.
Original Mortgage
$100,000
Interest Rate
7.62%
Create a Home Valuation Report for This Property
The Home Valuation Report is an in-depth analysis detailing your home's value as well as a comparison with similar homes in the area
Home Values in the Area
Average Home Value in this Area
Purchase History
| Date | Buyer | Sale Price | Title Company |
|---|---|---|---|
| Delmastro Christopher P | -- | None Listed On Document | |
| Delmastro Christopher P | -- | None Listed On Document | |
| Delmastro Theresa | $340,000 | -- | |
| Messaros Clifford J | $258,000 | -- | |
| Jan Llc | $175,000 | -- | |
| Weiss Julie A | $196,000 | Chicago Title Insurance Co | |
| Sprott Alisa | $140,000 | -- |
Source: Public Records
Mortgage History
| Date | Status | Borrower | Loan Amount |
|---|---|---|---|
| Previous Owner | Weiss Julie A | $100,000 | |
| Previous Owner | Sprott Alisa | $100,000 |
Source: Public Records
Tax History Compared to Growth
Tax History
| Year | Tax Paid | Tax Assessment Tax Assessment Total Assessment is a certain percentage of the fair market value that is determined by local assessors to be the total taxable value of land and additions on the property. | Land | Improvement |
|---|---|---|---|---|
| 2025 | $5,837 | $282,800 | $175,000 | $107,800 |
| 2024 | $5,761 | $282,800 | $175,000 | $107,800 |
| 2023 | $5,577 | $282,800 | $175,000 | $107,800 |
| 2022 | $5,577 | $282,800 | $175,000 | $107,800 |
| 2021 | $5,517 | $282,800 | $175,000 | $107,800 |
| 2020 | $5,385 | $282,800 | $175,000 | $107,800 |
| 2019 | $5,206 | $282,800 | $175,000 | $107,800 |
| 2018 | $5,133 | $282,800 | $175,000 | $107,800 |
| 2017 | $5,051 | $282,800 | $175,000 | $107,800 |
| 2016 | $4,941 | $282,800 | $175,000 | $107,800 |
| 2015 | $4,873 | $282,800 | $175,000 | $107,800 |
| 2014 | $4,791 | $282,800 | $175,000 | $107,800 |
Source: Public Records
Map
Nearby Homes
- 1271 Heath Ct
- 1088 Ash Dr
- 861 Juniper Way
- 950 Juniper Way Unit B1
- 926 Juniper Way
- 188 Grandview Ln
- 689 Plum Terrace Unit 31E
- 686 Plum Terrace
- 707 Pepperidge Rd Unit 30C
- 42 Peterson Place
- 673 Juniper Way
- 162 Grandview Ln Unit 162
- 227 Mountainview Dr
- 92 Hopkins Ct
- 309 Linden St
- 206 Peterson Place
- 366 Cottonwood Way
- 212 Larch Ln Unit F3
- 289 Vista View Dr
- 224 Larch Ln
- 1185 Sycamore Ln
- 1187 Sycamore Ln Unit A3
- 1188 Sycamore Ln
- 1059 Ash Dr
- 1060 Ash Dr
- 1189 Sycamore Ln
- 1061 Ash Dr Unit C2
- 1190 Sycamore Ln
- 1062 Ash Dr
- 1191 Sycamore Ln
- 1192 Sycamore Ln
- 1173 Sycamore Ln
- 1063 Ash Dr
- 1050 Ash Dr
- 1064 Ash Dr
- 1193 Sycamore Ln
- 1172 Sycamore Ln
- 1049 Ash Dr Unit E2
- 1194 Sycamore Ln
- 1171 Sycamore Ln