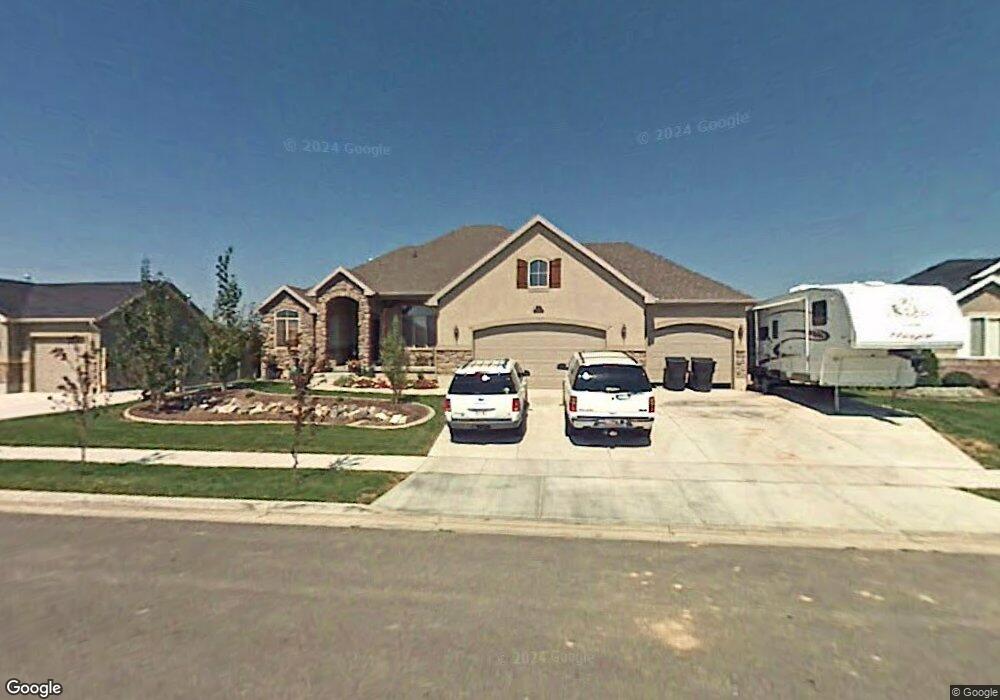
1186 W 2175 S Syracuse, UT 84075
Estimated Value: $610,000 - $697,000
6
Beds
3
Baths
3,460
Sq Ft
$187/Sq Ft
Est. Value
About This Home
This home is located at 1186 W 2175 S, Syracuse, UT 84075 and is currently estimated at $648,442, approximately $187 per square foot. 1186 W 2175 S is a home located in Davis County with nearby schools including Bluff Ridge Elementary, Legacy Junior High School, and Clearfield High School.
Ownership History
Date
Name
Owned For
Owner Type
Purchase Details
Closed on
Jan 25, 2024
Sold by
Conine Thomas H and Mjika Vee
Bought by
Conine Thomas H and Conine Thomas H
Current Estimated Value
Purchase Details
Closed on
Apr 11, 2008
Sold by
Jones Justin D
Bought by
Conine Thomas H and Conine Mjika Vee
Home Financials for this Owner
Home Financials are based on the most recent Mortgage that was taken out on this home.
Original Mortgage
$351,484
Interest Rate
6.22%
Mortgage Type
FHA
Purchase Details
Closed on
Oct 5, 2004
Sold by
Destination Homes Inc
Bought by
Jones Justin D
Home Financials for this Owner
Home Financials are based on the most recent Mortgage that was taken out on this home.
Original Mortgage
$176,304
Interest Rate
5.76%
Mortgage Type
Purchase Money Mortgage
Purchase Details
Closed on
Jun 14, 2004
Sold by
Hawthorn Llc
Bought by
Destination Homes Inc
Create a Home Valuation Report for This Property
The Home Valuation Report is an in-depth analysis detailing your home's value as well as a comparison with similar homes in the area
Home Values in the Area
Average Home Value in this Area
Purchase History
| Date | Buyer | Sale Price | Title Company |
|---|---|---|---|
| Conine Thomas H | -- | None Listed On Document | |
| Conine Thomas H | -- | First American Title | |
| Jones Justin D | -- | Security Title Company | |
| Destination Homes Inc | -- | Security Title Company |
Source: Public Records
Mortgage History
| Date | Status | Borrower | Loan Amount |
|---|---|---|---|
| Previous Owner | Conine Thomas H | $351,484 | |
| Previous Owner | Jones Justin D | $176,304 | |
| Closed | Jones Justin D | $33,057 |
Source: Public Records
Tax History
| Year | Tax Paid | Tax Assessment Tax Assessment Total Assessment is a certain percentage of the fair market value that is determined by local assessors to be the total taxable value of land and additions on the property. | Land | Improvement |
|---|---|---|---|---|
| 2025 | $3,517 | $339,350 | $125,024 | $214,326 |
| 2024 | $3,109 | $301,950 | $103,457 | $198,493 |
| 2023 | $3,108 | $550,000 | $144,152 | $405,848 |
| 2022 | $3,339 | $323,950 | $82,972 | $240,978 |
| 2021 | $2,969 | $446,000 | $122,621 | $323,379 |
| 2020 | $2,661 | $387,000 | $106,789 | $280,211 |
| 2019 | $2,563 | $368,000 | $104,414 | $263,586 |
| 2018 | $2,400 | $342,000 | $100,824 | $241,176 |
| 2016 | $2,154 | $160,930 | $38,697 | $122,233 |
| 2015 | $2,106 | $149,875 | $38,697 | $111,178 |
| 2014 | $2,057 | $149,184 | $38,697 | $110,487 |
| 2013 | -- | $144,395 | $38,775 | $105,620 |
Source: Public Records
Map
Nearby Homes
Your Personal Tour Guide
Ask me questions while you tour the home.