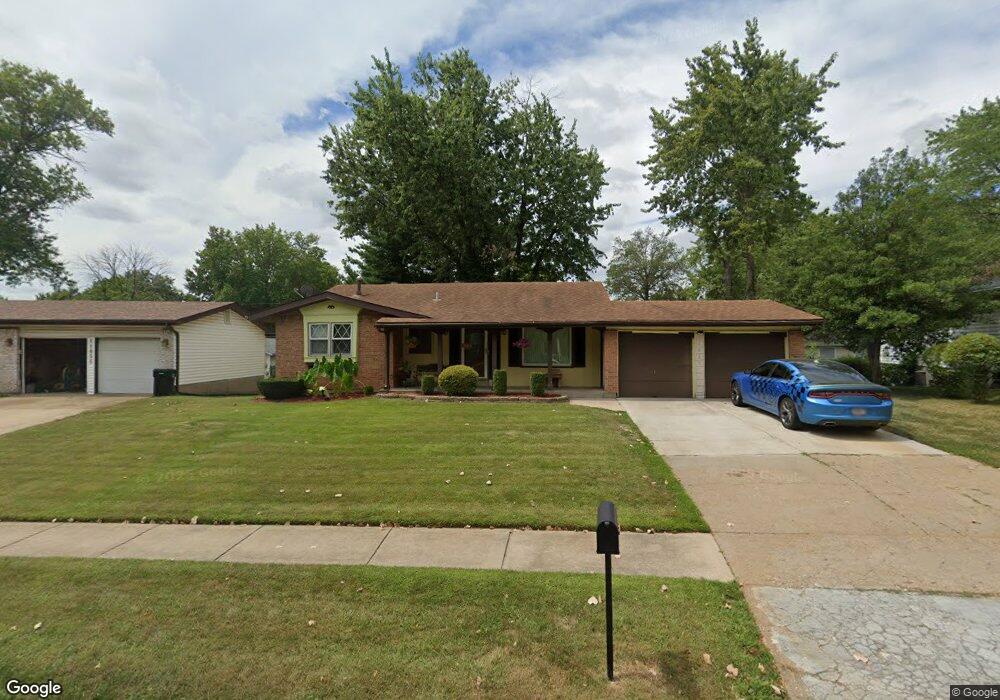
11865 Brampton Hunt Rd Florissant, MO 63033
Estimated Value: $182,000 - $210,000
3
Beds
2
Baths
1,294
Sq Ft
$150/Sq Ft
Est. Value
About This Home
This home is located at 11865 Brampton Hunt Rd, Florissant, MO 63033 and is currently estimated at $194,601, approximately $150 per square foot. 11865 Brampton Hunt Rd is a home located in St. Louis County with nearby schools including Jury Elementary School, Central Middle School, and Hazelwood Central High School.
Ownership History
Date
Name
Owned For
Owner Type
Purchase Details
Closed on
May 29, 2013
Sold by
Tag Realty Investments Llc
Bought by
Whitfield Geneva
Current Estimated Value
Home Financials for this Owner
Home Financials are based on the most recent Mortgage that was taken out on this home.
Original Mortgage
$76,587
Outstanding Balance
$54,148
Interest Rate
3.43%
Mortgage Type
FHA
Estimated Equity
$140,453
Purchase Details
Closed on
Jan 1, 2013
Sold by
Glasgow Tina
Bought by
Tag Realty Investments Llc
Purchase Details
Closed on
Jul 20, 2012
Sold by
William J Glagow Ii Llc
Bought by
Glasgow Tina
Purchase Details
Closed on
Oct 27, 2009
Sold by
Nicholson Michael P and Nicholson Ceola
Bought by
William J Glasgow Ii Llc
Purchase Details
Closed on
Aug 26, 2009
Sold by
Nicholson Michael P Ceola
Bought by
William J Glasgow Ii Llc
Create a Home Valuation Report for This Property
The Home Valuation Report is an in-depth analysis detailing your home's value as well as a comparison with similar homes in the area
Home Values in the Area
Average Home Value in this Area
Purchase History
| Date | Buyer | Sale Price | Title Company |
|---|---|---|---|
| Whitfield Geneva | $78,000 | Title Experts Llc | |
| Tag Realty Investments Llc | -- | None Available | |
| Glasgow Tina | $92,001 | None Available | |
| William J Glasgow Ii Llc | $18,100 | None Available | |
| William J Glasgow Ii Llc | $18,100 | None Available |
Source: Public Records
Mortgage History
| Date | Status | Borrower | Loan Amount |
|---|---|---|---|
| Open | Whitfield Geneva | $76,587 |
Source: Public Records
Tax History Compared to Growth
Tax History
| Year | Tax Paid | Tax Assessment Tax Assessment Total Assessment is a certain percentage of the fair market value that is determined by local assessors to be the total taxable value of land and additions on the property. | Land | Improvement |
|---|---|---|---|---|
| 2025 | $2,707 | $30,730 | $4,640 | $26,090 |
| 2024 | $2,707 | $30,020 | $3,100 | $26,920 |
| 2023 | $2,700 | $30,020 | $3,100 | $26,920 |
| 2022 | $2,208 | $20,860 | $4,030 | $16,830 |
| 2021 | $2,113 | $20,860 | $4,030 | $16,830 |
| 2020 | $1,879 | $17,550 | $3,550 | $14,000 |
| 2019 | $1,853 | $17,550 | $3,550 | $14,000 |
| 2018 | $1,945 | $17,010 | $2,470 | $14,540 |
| 2017 | $1,942 | $17,010 | $2,470 | $14,540 |
| 2016 | $1,942 | $16,700 | $2,770 | $13,930 |
| 2015 | $1,898 | $16,700 | $2,770 | $13,930 |
| 2014 | $1,791 | $15,660 | $3,040 | $12,620 |
Source: Public Records
Map
Nearby Homes
- 5148 Longhorn Trail
- 11466 Granger Trail
- 4950 Patricia Ridge Dr
- 4497 Rhine Dr
- 11951 Jerries Ln
- 11636 MacRinus Dr
- 11707 MacRinus Dr
- 11869 Galba Dr
- 11519 Galba Dr
- 4493 Caracalla Dr
- 11767 MacRinus Dr
- 12062 Cato Dr
- 4471 Rhine Dr
- 4461 Rhine Dr
- 11565 Mehl Ave
- 2628 Hadden Dr
- 4401 Rhine Dr
- 30 Rolling Hills Dr
- 4384 Remus Dr
- 5239 Trailoaks Dr
- 11855 Brampton Hunt Rd
- 11875 Brampton Hunt Rd
- 11878 Barden Tower Rd
- 11868 Barden Tower Rd
- 11898 Barden Tower Rd
- 11845 Brampton Hunt Rd
- 11850 Brampton Hunt Rd
- 11885 Brampton Hunt Rd
- 11958 Barden Tower Rd
- 11858 Barden Tower Rd
- 11880 Brampton Hunt Rd
- 11840 Brampton Hunt Rd
- 11835 Brampton Hunt Rd
- 11873 Barden Tower Rd
- 11848 Barden Tower Rd
- 11890 Brampton Hunt Rd
- 11863 Barden Tower Rd
- 11883 Barden Tower Rd
- 11830 Brampton Hunt Rd
- 11913 Barden Tower Rd