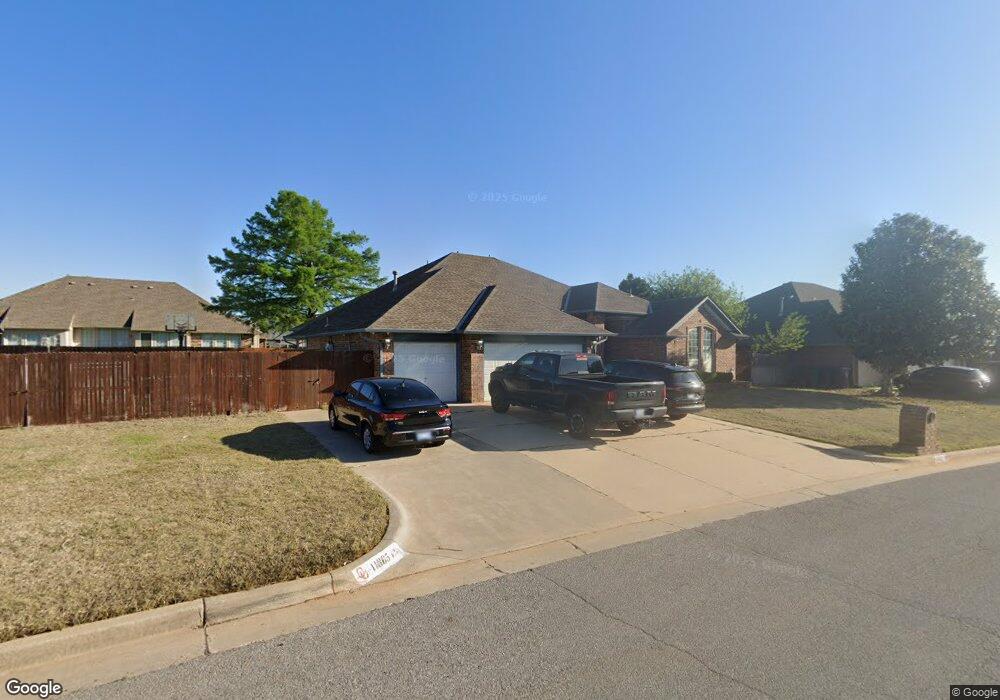
11865 SW 3rd Terrace Yukon, OK 73099
West Watch NeighborhoodEstimated Value: $282,000 - $401,377
4
Beds
2
Baths
2,858
Sq Ft
$116/Sq Ft
Est. Value
About This Home
This home is located at 11865 SW 3rd Terrace, Yukon, OK 73099 and is currently estimated at $330,344, approximately $115 per square foot. 11865 SW 3rd Terrace is a home located in Canadian County with nearby schools including Mustang Creek Elementary School, Meadow Brook Intermediate School, and Mustang Central Middle School.
Ownership History
Date
Name
Owned For
Owner Type
Purchase Details
Closed on
Dec 10, 2008
Sold by
Lawson Brenda Kay and Lawson Tony H
Bought by
Mann Michael D and Mann Nita
Current Estimated Value
Home Financials for this Owner
Home Financials are based on the most recent Mortgage that was taken out on this home.
Original Mortgage
$218,813
Outstanding Balance
$147,030
Interest Rate
6.48%
Estimated Equity
$183,314
Purchase Details
Closed on
Jul 19, 2002
Sold by
Gresham Mary Jo and Ohn T~Trste#
Home Financials for this Owner
Home Financials are based on the most recent Mortgage that was taken out on this home.
Original Mortgage
$130,000
Interest Rate
6.73%
Purchase Details
Closed on
Dec 28, 1999
Sold by
Gresham John T and Mary Jo
Purchase Details
Closed on
Mar 29, 1993
Sold by
Westbrooke Homes Inc
Create a Home Valuation Report for This Property
The Home Valuation Report is an in-depth analysis detailing your home's value as well as a comparison with similar homes in the area
Home Values in the Area
Average Home Value in this Area
Purchase History
| Date | Buyer | Sale Price | Title Company |
|---|---|---|---|
| Mann Michael D | $165,000 | None Available | |
| -- | $168,000 | -- | |
| -- | -- | -- | |
| -- | $102,000 | -- | |
| -- | $5,000 | -- |
Source: Public Records
Mortgage History
| Date | Status | Borrower | Loan Amount |
|---|---|---|---|
| Open | Mann Michael D | $218,813 | |
| Previous Owner | -- | $130,000 |
Source: Public Records
Tax History Compared to Growth
Tax History
| Year | Tax Paid | Tax Assessment Tax Assessment Total Assessment is a certain percentage of the fair market value that is determined by local assessors to be the total taxable value of land and additions on the property. | Land | Improvement |
|---|---|---|---|---|
| 2024 | $3,132 | $29,519 | $3,873 | $25,646 |
| 2023 | $3,132 | $28,659 | $3,646 | $25,013 |
| 2022 | $3,083 | $27,824 | $3,373 | $24,451 |
| 2021 | $2,979 | $27,014 | $2,880 | $24,134 |
| 2020 | $3,042 | $27,294 | $2,880 | $24,414 |
| 2019 | $2,947 | $26,499 | $2,880 | $23,619 |
| 2018 | $2,911 | $25,728 | $2,880 | $22,848 |
| 2017 | $2,906 | $26,013 | $2,880 | $23,133 |
| 2016 | $2,919 | $26,189 | $2,880 | $23,309 |
| 2015 | $3,099 | $28,215 | $2,880 | $25,335 |
| 2014 | $3,099 | $27,537 | $2,880 | $24,657 |
Source: Public Records
Map
Nearby Homes
- 509 Bluegrass Ln
- 212 Sage Brush Rd
- 121 Pawnee Place
- 11741 Oakdale St
- 720 Sage Brush Rd
- 418 Palo Verde Dr
- 708 Cactus Ct
- 11600 SW 3rd St
- 612 S Willowood Dr
- 11612 SW 5th St
- 12127 SW 4th St
- 1000 Redwood Creek Dr
- 1004 Redwood Creek Dr
- 1008 Redwood Creek Dr
- 1012 Redwood Creek Dr
- 1016 Redwood Creek Dr
- 624 Caladium Dr
- 1005 Redwood Creek Dr
- 1009 Redwood Creek Dr
- 1013 Redwood Creek Dr
- 11860 SW 3rd St
- 11868 SW 3rd St
- 11856 SW 3rd St
- 11864 SW 3rd Terrace
- 11857 SW 3rd Terrace
- 11868 SW 3rd Terrace
- 11860 SW 3rd Terrace
- 11852 SW 3rd St
- 321 Out West Trail
- 317 Out West Trail
- 401 Out West Trail
- 401 Out Trail W
- 11853 SW 3rd Terrace
- 11865 SW 3rd St
- 313 Out West Trail
- 313 Out Trail W
- 11861 SW 3rd Terrace
- 11881 SW 4th St
- 11856 SW 3rd Terrace
- 11869 SW 3rd St