11866 W Stanford Place Morrison, CO 80465
Friendly Hills NeighborhoodEstimated Value: $538,000 - $615,000
2
Beds
3
Baths
2,556
Sq Ft
$224/Sq Ft
Est. Value
About This Home
This home is located at 11866 W Stanford Place, Morrison, CO 80465 and is currently estimated at $571,642, approximately $223 per square foot. 11866 W Stanford Place is a home located in Jefferson County with nearby schools including Kendallvue Elementary School, Carmody Middle School, and Bear Creek High School.
Ownership History
Date
Name
Owned For
Owner Type
Purchase Details
Closed on
Jul 14, 2016
Sold by
Green Joan C
Bought by
Green Joan C
Current Estimated Value
Purchase Details
Closed on
Aug 7, 2014
Sold by
Green Charles F and Green Joan C
Bought by
Charles F Green Jr Trust and Joan C Green Trust
Purchase Details
Closed on
Aug 15, 2011
Sold by
Siegenthaler George I and Siegenthaler Deborah
Bought by
Green Charles F and Green Joan C
Purchase Details
Closed on
Jun 27, 2003
Sold by
Siegenthaler Deborah and Siegenthaler George I
Bought by
Siegenthaler Deborah and Siegenthaler George I
Purchase Details
Closed on
Feb 15, 2002
Sold by
1995 Corp
Bought by
Siegenthaler Deborah and Siegenthaler George I
Home Financials for this Owner
Home Financials are based on the most recent Mortgage that was taken out on this home.
Original Mortgage
$185,954
Interest Rate
7.12%
Create a Home Valuation Report for This Property
The Home Valuation Report is an in-depth analysis detailing your home's value as well as a comparison with similar homes in the area
Home Values in the Area
Average Home Value in this Area
Purchase History
| Date | Buyer | Sale Price | Title Company |
|---|---|---|---|
| Green Joan C | -- | None Available | |
| Green Joan C | -- | None Available | |
| Charles F Green Jr Trust | -- | None Available | |
| Green Charles F | $245,000 | Land Title Guarantee Company | |
| Siegenthaler Deborah | -- | -- | |
| Siegenthaler Deborah | $232,443 | -- |
Source: Public Records
Mortgage History
| Date | Status | Borrower | Loan Amount |
|---|---|---|---|
| Previous Owner | Siegenthaler Deborah | $185,954 |
Source: Public Records
Tax History Compared to Growth
Tax History
| Year | Tax Paid | Tax Assessment Tax Assessment Total Assessment is a certain percentage of the fair market value that is determined by local assessors to be the total taxable value of land and additions on the property. | Land | Improvement |
|---|---|---|---|---|
| 2024 | $2,649 | $33,746 | $6,030 | $27,716 |
| 2023 | $2,649 | $33,746 | $6,030 | $27,716 |
| 2022 | $2,132 | $28,327 | $4,170 | $24,157 |
| 2021 | $2,862 | $29,142 | $4,290 | $24,852 |
| 2020 | $2,909 | $29,687 | $4,290 | $25,397 |
| 2019 | $2,873 | $29,687 | $4,290 | $25,397 |
| 2018 | $2,573 | $25,677 | $3,600 | $22,077 |
| 2017 | $2,348 | $25,677 | $3,600 | $22,077 |
| 2016 | $2,134 | $22,519 | $3,184 | $19,335 |
| 2015 | $1,081 | $22,519 | $3,184 | $19,335 |
| 2014 | $1,896 | $18,762 | $2,229 | $16,533 |
Source: Public Records
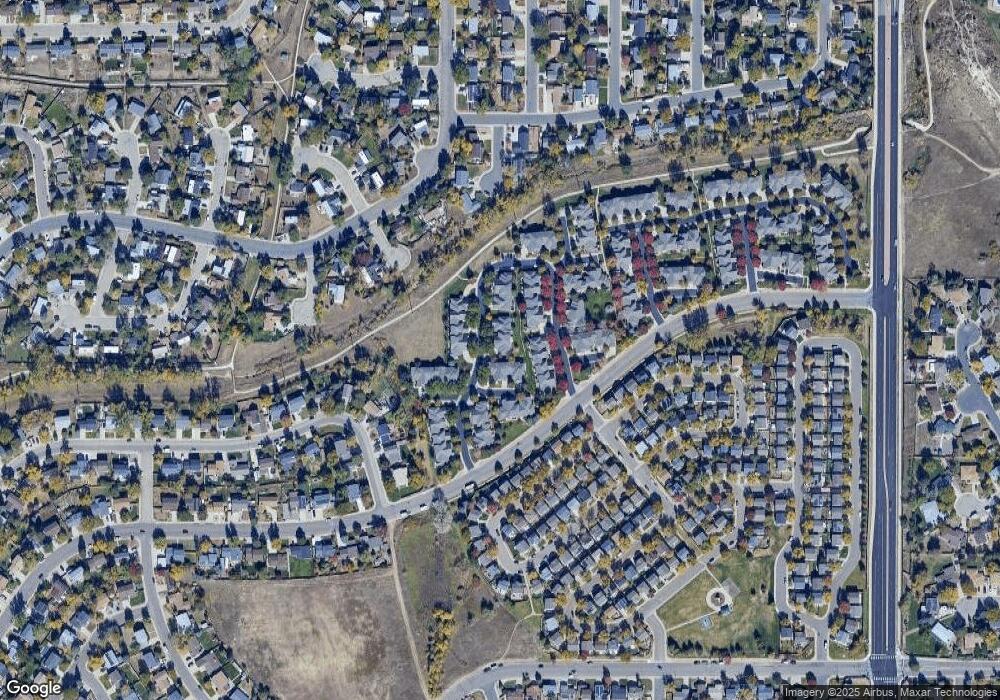
Map
Nearby Homes
- 11891 W Stanford Place
- 11898 W Tufts Place
- 11836 W Tulane Dr
- 11705 W Stanford Ln
- 4688 S Swadley Way
- 4570 S Swadley Ct
- 12222 W Quinn Dr
- 4416 S Vivian St
- 4726 S Taft St
- 4420 S Vivian Way
- 11200 W Tanforan Cir
- 4845 S Taft St
- 11470 W Tanforan Cir
- 12234 W Saratoga Ave
- 12864 W Tufts Ave
- 11040 W Tulane Ave
- 4977 S Urban Ct
- 13018 W Marlowe Ave
- 13078 W Marlowe Ave
- 13147 W Marlowe Ave
- 11862 W Stanford Place
- 11859 W Temple Ln
- 11856 W Stanford Place
- 11867 W Temple Ln
- 11857 W Temple Ln
- 11865 W Stanford Place
- 11861 W Stanford Place
- 4559 S Taft Way
- 4565 S Taft Way
- 11855 W Stanford Place
- 11852 W Stanford Place
- 4555 S Taft Way
- 4575 S Taft Way
- 11851 W Stanford Place
- 4549 S Taft Way
- 11871 W Stanford Place Unit D
- 4585 S Taft Way
- 11846 W Stanford Place
- 4545 S Taft Way
- 11845 W Stanford Place