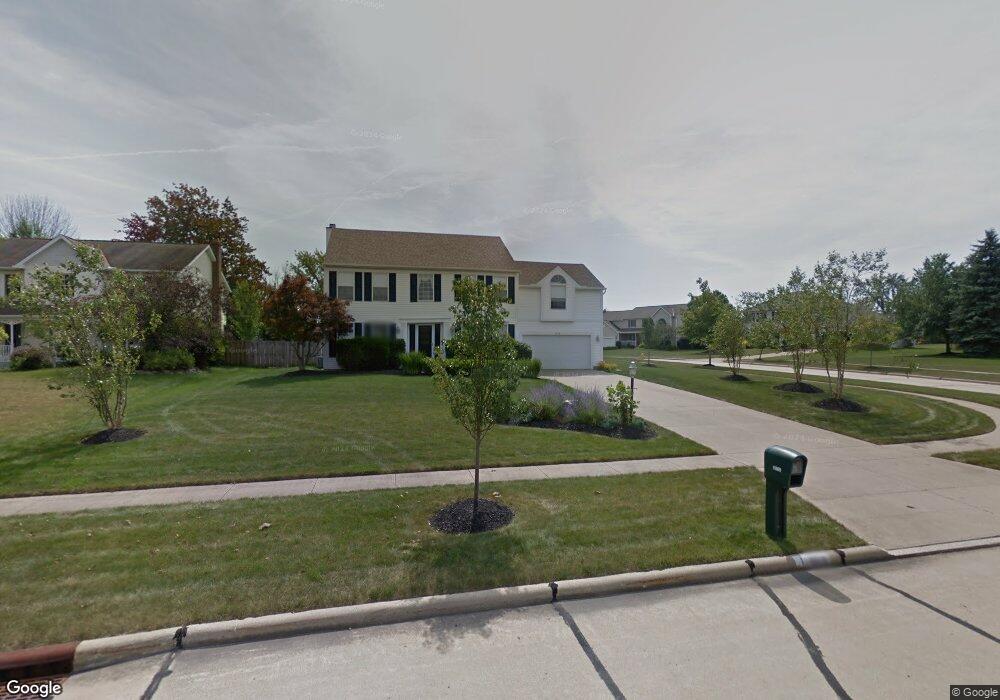
11869 Greyfriars Cir North Royalton, OH 44133
Estimated Value: $425,000 - $498,000
4
Beds
3
Baths
2,563
Sq Ft
$177/Sq Ft
Est. Value
About This Home
This home is located at 11869 Greyfriars Cir, North Royalton, OH 44133 and is currently estimated at $454,071, approximately $177 per square foot. 11869 Greyfriars Cir is a home located in Cuyahoga County with nearby schools including North Royalton Middle School, North Royalton High School, and Royal Redeemer Lutheran School.
Ownership History
Date
Name
Owned For
Owner Type
Purchase Details
Closed on
Apr 9, 2009
Sold by
Hnylka Mary Ellen and Hnylka Gregory S
Bought by
Schule Jacqueline J and Schule Richard W
Current Estimated Value
Home Financials for this Owner
Home Financials are based on the most recent Mortgage that was taken out on this home.
Original Mortgage
$194,085
Outstanding Balance
$123,809
Interest Rate
5.11%
Mortgage Type
VA
Estimated Equity
$330,262
Purchase Details
Closed on
Apr 24, 2003
Sold by
Hnylka Mary Ellen and Hnylka Gregory S
Bought by
Hnylka Gregory S and Hnylka Mary Ellen
Home Financials for this Owner
Home Financials are based on the most recent Mortgage that was taken out on this home.
Original Mortgage
$127,500
Interest Rate
5%
Purchase Details
Closed on
Apr 21, 1994
Bought by
Marques Antonio J
Purchase Details
Closed on
Jan 1, 1993
Bought by
Whitlatch & Co
Create a Home Valuation Report for This Property
The Home Valuation Report is an in-depth analysis detailing your home's value as well as a comparison with similar homes in the area
Home Values in the Area
Average Home Value in this Area
Purchase History
| Date | Buyer | Sale Price | Title Company |
|---|---|---|---|
| Schule Jacqueline J | $190,000 | Ohio Title Corporation | |
| Hnylka Gregory S | -- | Ohio Title Corporation | |
| Marques Antonio J | $176,800 | -- | |
| Whitlatch & Co | -- | -- |
Source: Public Records
Mortgage History
| Date | Status | Borrower | Loan Amount |
|---|---|---|---|
| Open | Schule Jacqueline J | $194,085 | |
| Closed | Hnylka Gregory S | $127,500 |
Source: Public Records
Tax History Compared to Growth
Tax History
| Year | Tax Paid | Tax Assessment Tax Assessment Total Assessment is a certain percentage of the fair market value that is determined by local assessors to be the total taxable value of land and additions on the property. | Land | Improvement |
|---|---|---|---|---|
| 2024 | $7,768 | $133,735 | $30,135 | $103,600 |
| 2023 | $6,364 | $100,490 | $26,780 | $73,710 |
| 2022 | $6,321 | $100,490 | $26,780 | $73,710 |
| 2021 | $6,388 | $100,490 | $26,780 | $73,710 |
| 2020 | $5,649 | $84,460 | $22,510 | $61,950 |
| 2019 | $5,455 | $240,000 | $64,300 | $175,700 |
| 2018 | $4,873 | $84,000 | $22,510 | $61,500 |
| 2017 | $4,519 | $65,770 | $17,890 | $47,880 |
| 2016 | $4,235 | $65,770 | $17,890 | $47,880 |
| 2015 | $4,142 | $65,770 | $17,890 | $47,880 |
| 2014 | $4,142 | $63,840 | $17,360 | $46,480 |
Source: Public Records
Map
Nearby Homes
- 11886 Friar Post
- 18680 Bennett Rd
- 10244 Hidden Valley Dr
- 2160 Boston Rd Unit B
- 2160 Boston Rd Unit AB
- 0 V L Boston Rd Unit 5138046
- 95 Valley Brook Blvd
- 20745 Evergreen Trail
- 204 Brookside Blvd
- 10281 River Run Ln
- 17390 Bennett Rd
- 8700 Boston Rd
- 13335 Tradewinds Dr
- VL 2 Hidden Ridge Rd
- VL 5 Hidden Ridge Rd
- VL3 Hidden Ridge Rd
- 19297 Hunt Rd
- 13448 Compass Point Dr
- VL4 Hidden Ridge Rd
- 19252 Hidden Woods Ln
- 11859 Greyfriars Cir
- 11794 Harrow Place
- 11829 Harrow Place
- 11819 Harrow Place
- 11849 Greyfriars Cir
- 11876 Greyfriars Cir
- 11809 Harrow Place
- 11784 Harrow Place
- 11799 Harrow Place
- 11866 Greyfriars Cir
- 11886 Greyfriars Cir
- 11789 Harrow Place
- 11856 Greyfriars Cir
- 11839 Greyfriars Cir
- 11889 Greyfriars Cir
- 11846 Greyfriars Cir
- 11896 Greyfriars Cir
- 11779 Harrow Place
- 11836 Greyfriars Cir
- 19512 Rye Gate Dr