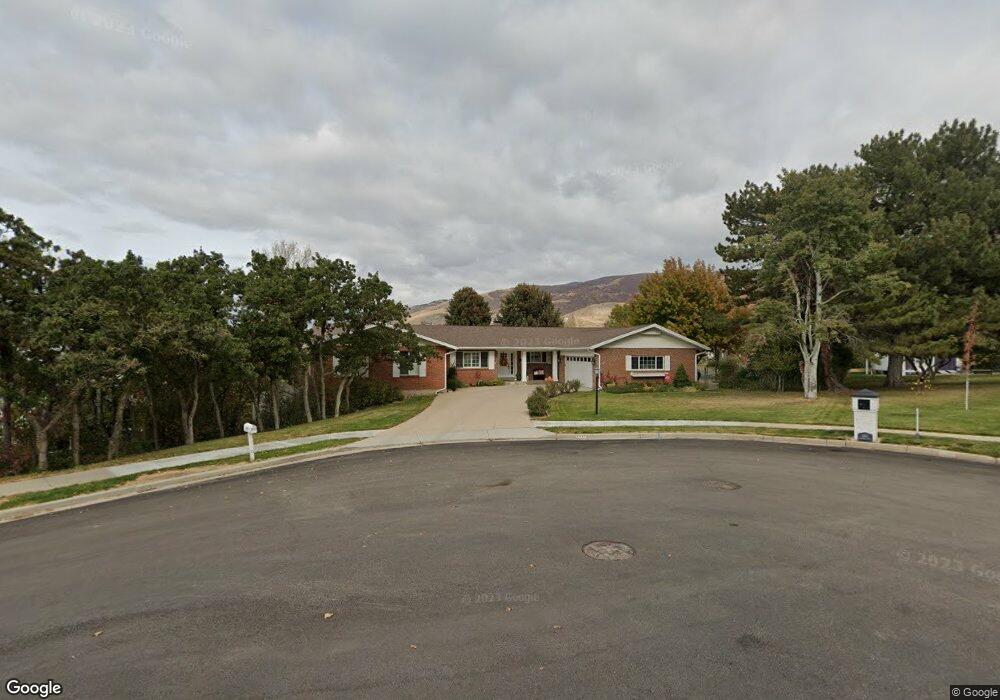
1187 Oakridge Cir Bountiful, UT 84010
Estimated Value: $794,000 - $934,000
--
Bed
4
Baths
2,453
Sq Ft
$352/Sq Ft
Est. Value
About This Home
This home is located at 1187 Oakridge Cir, Bountiful, UT 84010 and is currently estimated at $863,971, approximately $352 per square foot. 1187 Oakridge Cir is a home located in Davis County with nearby schools including Oak Hills School, Millcreek Junior High School, and Bountiful High School.
Ownership History
Date
Name
Owned For
Owner Type
Purchase Details
Closed on
Nov 18, 2020
Sold by
Nelson Kendell E and Nelson Kelly Jan
Bought by
Nelson Kendell E and Nelson Kelly J
Current Estimated Value
Purchase Details
Closed on
Jul 13, 2017
Sold by
Lewis D Clark
Bought by
Nelson Kendell E and Nelson Kelly Jan
Purchase Details
Closed on
Apr 26, 2017
Sold by
Clark Lewis D and Clark Maureen B
Bought by
Lewis D Clark and Clark Family Trust
Purchase Details
Closed on
Apr 26, 2002
Sold by
Tolman E Dennis and Joyce Tolman E
Bought by
Clark Lewis D and Clark Maureen B
Home Financials for this Owner
Home Financials are based on the most recent Mortgage that was taken out on this home.
Original Mortgage
$227,200
Interest Rate
7.08%
Create a Home Valuation Report for This Property
The Home Valuation Report is an in-depth analysis detailing your home's value as well as a comparison with similar homes in the area
Purchase History
| Date | Buyer | Sale Price | Title Company |
|---|---|---|---|
| Nelson Kendell E | -- | None Available | |
| Nelson Kendell E | -- | Stewart Title | |
| Lewis D Clark | -- | -- | |
| Clark Lewis D | -- | First American Title Co |
Source: Public Records
Mortgage History
| Date | Status | Borrower | Loan Amount |
|---|---|---|---|
| Previous Owner | Clark Lewis D | $227,200 |
Source: Public Records
Tax History
| Year | Tax Paid | Tax Assessment Tax Assessment Total Assessment is a certain percentage of the fair market value that is determined by local assessors to be the total taxable value of land and additions on the property. | Land | Improvement |
|---|---|---|---|---|
| 2025 | $4,729 | $423,500 | $200,751 | $222,749 |
| 2024 | $4,403 | $406,450 | $183,992 | $222,458 |
| 2023 | $4,410 | $742,000 | $348,286 | $393,714 |
| 2022 | $4,575 | $422,950 | $187,559 | $235,391 |
| 2021 | $4,136 | $587,000 | $280,061 | $306,939 |
| 2020 | $3,472 | $491,000 | $254,674 | $236,326 |
| 2019 | $3,547 | $478,000 | $219,210 | $258,790 |
| 2018 | $3,271 | $444,000 | $207,693 | $236,307 |
| 2016 | $3,043 | $216,260 | $79,253 | $137,007 |
| 2015 | $2,953 | $203,775 | $79,253 | $124,522 |
| 2014 | $2,692 | $192,180 | $79,253 | $112,927 |
| 2013 | -- | $161,671 | $70,013 | $91,658 |
Source: Public Records
Map
Nearby Homes
- 861 E Millbrook Way
- 795 Abby Ln Unit 5
- 1785 1450 E Unit 604
- 1087 Arlington Way
- 1475 Mueller Park Rd
- 1888 S 1150 E
- 1138 Briggs Dr
- 1596 E Millbrook Way
- 1735 S Temple Ct Unit 203
- 0 Lot Bountiful Blvd
- 631 E 1700 S
- 1987 Mapleview Dr
- 380 E 1500 S
- 323 Peach Ln
- 520 S Orchard Dr Unit 17
- 1742 E Ridge Point Dr
- 285 E 1100 S
- 275 E Peach Ln S
- 1886 S Jeri Dr
- 842 E 2150 S
- 1201 Oakridge Cir
- 1165 Oakridge Cir
- 1084 Canyon Crest Dr
- 1190 Oakridge Cir
- 1036 Canyon Crest Dr
- 1110 Canyon Crest Dr
- 1153 Oakridge Cir
- 1070 Oakridge Cir
- 1070 Oakridge Cir
- 1008 Canyon Crest Dr
- 1141 Oakridge Ln
- 1171 Oakridge Ln
- 1185 Oakridge Ln
- 1140 Canyon Crest Dr
- 1147 Bountiful Hills Dr
- 1205 Oakridge Ln
- 1051 S 1250 E
- 1051 Canyon Crest Dr
- 968 Canyon Crest Dr
- 1035 Canyon Crest Dr
Your Personal Tour Guide
Ask me questions while you tour the home.