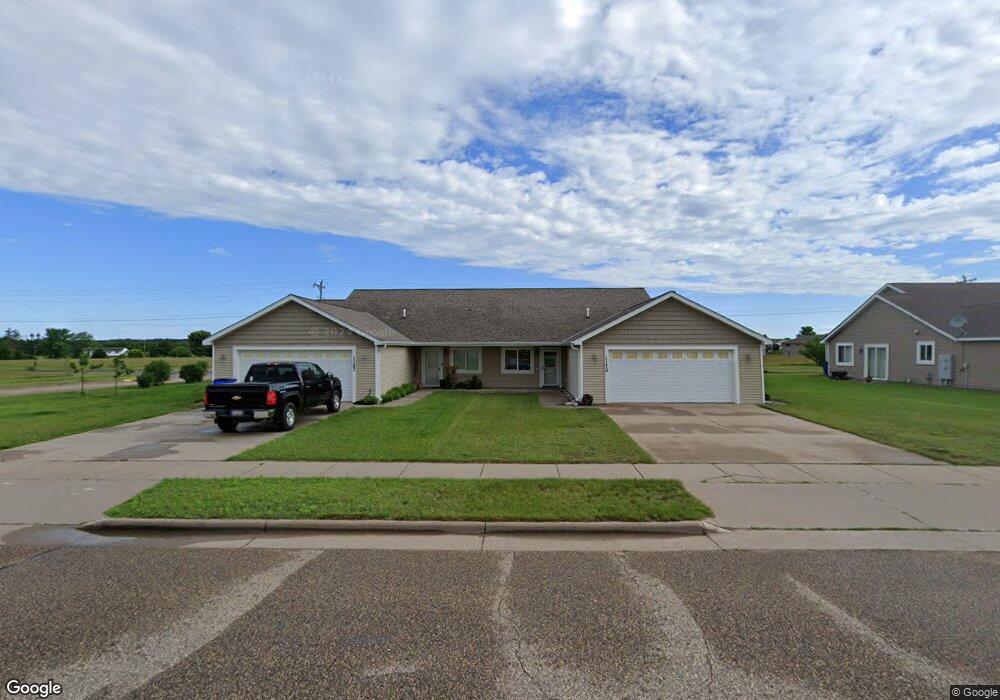
1187 Sugar Pine Ln New Richmond, WI 54017
Estimated Value: $266,000 - $308,615
3
Beds
2
Baths
1,404
Sq Ft
$203/Sq Ft
Est. Value
About This Home
This home is located at 1187 Sugar Pine Ln, New Richmond, WI 54017 and is currently estimated at $284,904, approximately $202 per square foot. 1187 Sugar Pine Ln is a home located in St. Croix County with nearby schools including New Richmond High School and St. Mary School.
Ownership History
Date
Name
Owned For
Owner Type
Purchase Details
Closed on
Mar 31, 2015
Sold by
Millard Judith A
Bought by
Dreawves Dustin M and Mathis Charity E
Current Estimated Value
Home Financials for this Owner
Home Financials are based on the most recent Mortgage that was taken out on this home.
Original Mortgage
$130,950
Outstanding Balance
$100,771
Interest Rate
3.73%
Mortgage Type
New Conventional
Estimated Equity
$184,133
Purchase Details
Closed on
Apr 9, 2013
Sold by
Lange Cooper and Lange Hannah
Bought by
Eggerichs Robert and Millard Judith
Purchase Details
Closed on
Nov 20, 2009
Sold by
Hodur Myreon
Bought by
Lange Cooper
Home Financials for this Owner
Home Financials are based on the most recent Mortgage that was taken out on this home.
Original Mortgage
$127,398
Interest Rate
4.9%
Mortgage Type
New Conventional
Purchase Details
Closed on
Feb 14, 2008
Sold by
Evergreen Valley Llc
Bought by
Hodur Myreon
Create a Home Valuation Report for This Property
The Home Valuation Report is an in-depth analysis detailing your home's value as well as a comparison with similar homes in the area
Home Values in the Area
Average Home Value in this Area
Purchase History
| Date | Buyer | Sale Price | Title Company |
|---|---|---|---|
| Dreawves Dustin M | $138,000 | Edina Realty Title Inc | |
| Eggerichs Robert | $125,000 | Land Title Inc | |
| Lange Cooper | $124,900 | Title One | |
| Hodur Myreon | $76,000 | None Available |
Source: Public Records
Mortgage History
| Date | Status | Borrower | Loan Amount |
|---|---|---|---|
| Open | Dreawves Dustin M | $130,950 | |
| Previous Owner | Lange Cooper | $127,398 |
Source: Public Records
Tax History Compared to Growth
Tax History
| Year | Tax Paid | Tax Assessment Tax Assessment Total Assessment is a certain percentage of the fair market value that is determined by local assessors to be the total taxable value of land and additions on the property. | Land | Improvement |
|---|---|---|---|---|
| 2024 | $38 | $272,600 | $30,200 | $242,400 |
| 2023 | $3,583 | $263,200 | $30,200 | $233,000 |
| 2022 | $2,989 | $233,800 | $30,200 | $203,600 |
| 2021 | $2,663 | $203,700 | $30,200 | $173,500 |
| 2020 | $2,688 | $118,500 | $9,000 | $109,500 |
| 2019 | $2,564 | $118,500 | $9,000 | $109,500 |
| 2018 | $2,606 | $118,500 | $9,000 | $109,500 |
| 2017 | $2,495 | $118,500 | $9,000 | $109,500 |
| 2016 | $2,495 | $118,500 | $9,000 | $109,500 |
| 2015 | $2,542 | $118,500 | $9,000 | $109,500 |
| 2014 | $2,477 | $118,500 | $9,000 | $109,500 |
| 2013 | $2,556 | $118,500 | $9,000 | $109,500 |
Source: Public Records
Map
Nearby Homes
- 1149 Sugar Pine Ln
- 1137 Sugar Pine Ln
- TBD Cattail Ln Unit Lot 7
- TBD Cattail Ln Unit Lot 8
- TBD Cattail Ln Unit Lot 9
- 1565 Ponderosa Ln
- 1824 White Pine Way
- 1430 Creekwood Dr
- 1422 Creekwood Dr
- 1549 Creekwood Dr
- TBD County Road A
- 1517 Creekwood Dr
- 1513 Creekwood Dr
- Kenny Plan at The Creek at Gloverdale
- Nora Plan at The Creek at Gloverdale
- Hudson Plan at The Creek at Gloverdale
- Aspen Plan at The Creek at Gloverdale
- Alder Plan at The Creek at Gloverdale
- Riley Plan at The Creek at Gloverdale
- Ashlyn Plan at The Creek at Gloverdale
- 1175 Sugar Pine Ln
- 1702 Ponderosa Ln
- Lot 79 Ponderosa Ln
- 1708 Ponderosa Ln
- 1713 Aspen Ct
- 1714 Ponderosa Ln
- 1719 Aspen Ct
- 1719 Aspen Ct
- 1731 Aspen Ct
- 1731 Aspen Ct
- 1710 Aspen Ct
- 1720 Ponderosa Ln
- 1739 Aspen Ct
- 1775 Aspen Ct
- 1061 Sugar Pine Ln
- 1720 Aspen Ct
- 1747 Aspen Ct
- 1728 Ponderosa Ln
- 1047 Sugar Pine Ln
- 1047 & 1061 Sugar Pine Ln Unit 1047 & 1061