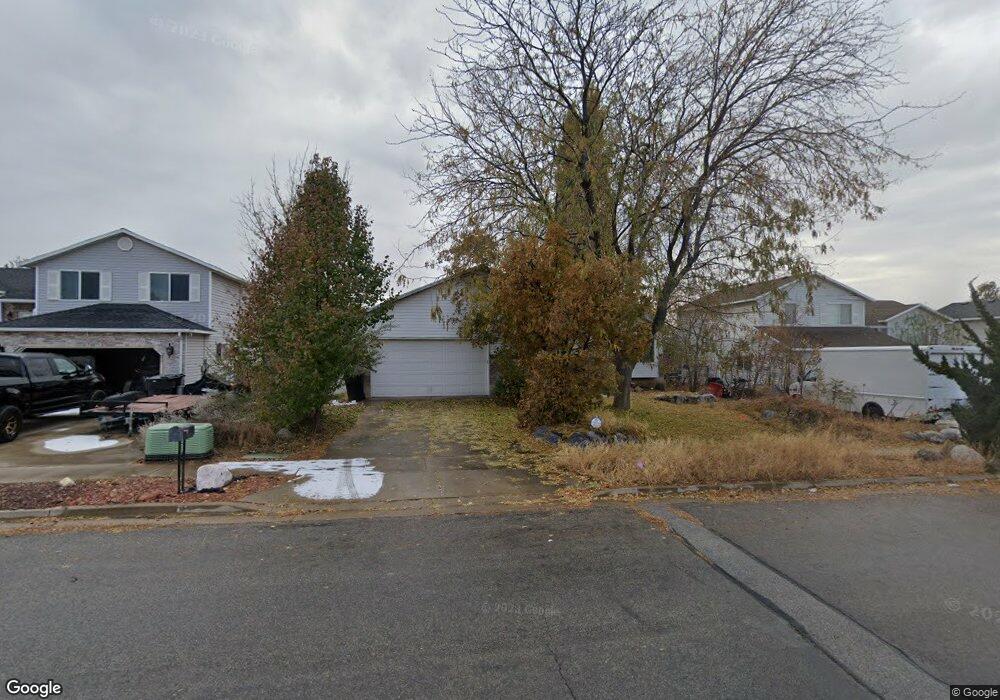
1187 W 1640 N Clearfield, UT 84015
Estimated Value: $427,000 - $465,000
4
Beds
2
Baths
2,066
Sq Ft
$213/Sq Ft
Est. Value
About This Home
This home is located at 1187 W 1640 N, Clearfield, UT 84015 and is currently estimated at $439,722, approximately $212 per square foot. 1187 W 1640 N is a home located in Davis County with nearby schools including Clinton Elementary School, Sunset Junior High School, and Clearfield High School.
Ownership History
Date
Name
Owned For
Owner Type
Purchase Details
Closed on
Oct 8, 2002
Sold by
Hud
Bought by
Sterner Shane
Current Estimated Value
Home Financials for this Owner
Home Financials are based on the most recent Mortgage that was taken out on this home.
Original Mortgage
$67,100
Outstanding Balance
$27,641
Interest Rate
6.05%
Estimated Equity
$412,081
Purchase Details
Closed on
Jun 19, 2002
Sold by
Wells Fargo Home Mtg Inc
Bought by
Hud
Purchase Details
Closed on
Jun 18, 2002
Sold by
Pittsinger Joel A
Bought by
Wells Fargo Home Mtg Inc
Purchase Details
Closed on
Apr 7, 1998
Sold by
Kirkman Tina J
Bought by
Pittsinger Joel A
Home Financials for this Owner
Home Financials are based on the most recent Mortgage that was taken out on this home.
Original Mortgage
$118,098
Interest Rate
7.07%
Mortgage Type
FHA
Purchase Details
Closed on
Oct 1, 1996
Sold by
Kirkman Max
Bought by
Kirkman Tina J
Create a Home Valuation Report for This Property
The Home Valuation Report is an in-depth analysis detailing your home's value as well as a comparison with similar homes in the area
Home Values in the Area
Average Home Value in this Area
Purchase History
| Date | Buyer | Sale Price | Title Company |
|---|---|---|---|
| Sterner Shane | -- | First American Title Co | |
| Hud | -- | Backman Stewart Title Svcs | |
| Wells Fargo Home Mtg Inc | $124,325 | Backman Stewart Title Servic | |
| Pittsinger Joel A | -- | Backman Stewart Title Servic | |
| Kirkman Tina J | -- | -- |
Source: Public Records
Mortgage History
| Date | Status | Borrower | Loan Amount |
|---|---|---|---|
| Open | Sterner Shane | $67,100 | |
| Previous Owner | Pittsinger Joel A | $118,098 |
Source: Public Records
Tax History Compared to Growth
Tax History
| Year | Tax Paid | Tax Assessment Tax Assessment Total Assessment is a certain percentage of the fair market value that is determined by local assessors to be the total taxable value of land and additions on the property. | Land | Improvement |
|---|---|---|---|---|
| 2025 | $2,385 | $229,350 | $81,484 | $147,866 |
| 2024 | $2,293 | $221,650 | $90,439 | $131,211 |
| 2023 | $2,114 | $378,000 | $101,374 | $276,626 |
| 2022 | $2,263 | $223,850 | $63,890 | $159,960 |
| 2021 | $2,064 | $303,000 | $76,820 | $226,180 |
| 2020 | $1,797 | $261,000 | $63,654 | $197,346 |
| 2019 | $1,748 | $248,000 | $77,413 | $170,587 |
| 2018 | $1,614 | $225,000 | $65,790 | $159,210 |
| 2016 | $1,440 | $103,675 | $25,270 | $78,405 |
| 2015 | $1,359 | $93,005 | $25,270 | $67,735 |
| 2014 | $1,274 | $88,617 | $25,270 | $63,347 |
| 2013 | -- | $86,382 | $21,497 | $64,885 |
Source: Public Records
Map
Nearby Homes