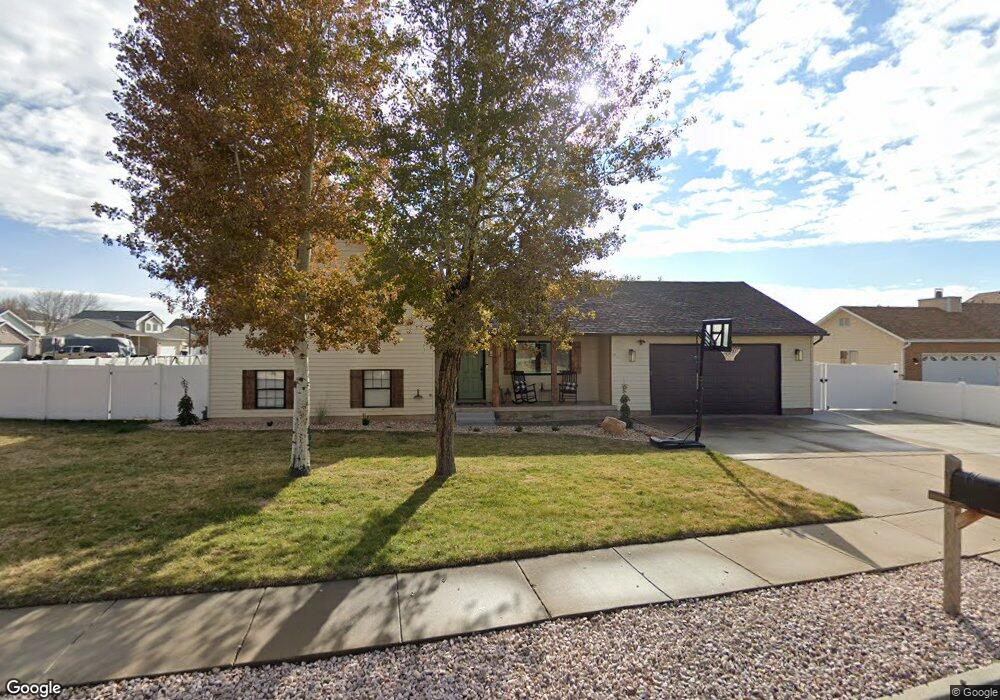
1187 W 2600 N Clearfield, UT 84015
Estimated Value: $437,000 - $456,000
5
Beds
3
Baths
1,788
Sq Ft
$250/Sq Ft
Est. Value
About This Home
This home is located at 1187 W 2600 N, Clearfield, UT 84015 and is currently estimated at $446,134, approximately $249 per square foot. 1187 W 2600 N is a home located in Davis County with nearby schools including Parkside Elementary School, Sunset Junior High School, and Clearfield High School.
Ownership History
Date
Name
Owned For
Owner Type
Purchase Details
Closed on
Jul 22, 2017
Sold by
Dewolf Jerald D
Bought by
Reese Kelly and Reese Kristin
Current Estimated Value
Home Financials for this Owner
Home Financials are based on the most recent Mortgage that was taken out on this home.
Original Mortgage
$220,924
Outstanding Balance
$189,419
Interest Rate
5.12%
Mortgage Type
FHA
Estimated Equity
$256,715
Purchase Details
Closed on
Aug 21, 2014
Sold by
Hodgson Edward A
Bought by
Real Estate Builders Llc
Purchase Details
Closed on
May 5, 2009
Sold by
Hodgson Edward A and Hodgson June B
Bought by
Hodgson Edward A
Home Financials for this Owner
Home Financials are based on the most recent Mortgage that was taken out on this home.
Original Mortgage
$180,083
Interest Rate
4.8%
Mortgage Type
FHA
Create a Home Valuation Report for This Property
The Home Valuation Report is an in-depth analysis detailing your home's value as well as a comparison with similar homes in the area
Home Values in the Area
Average Home Value in this Area
Purchase History
| Date | Buyer | Sale Price | Title Company |
|---|---|---|---|
| Reese Kelly | -- | Backman Title | |
| Real Estate Builders Llc | -- | Backman Title Service | |
| Hodgson Edward A | -- | Security Title |
Source: Public Records
Mortgage History
| Date | Status | Borrower | Loan Amount |
|---|---|---|---|
| Open | Reese Kelly | $220,924 | |
| Previous Owner | Hodgson Edward A | $180,083 |
Source: Public Records
Tax History Compared to Growth
Tax History
| Year | Tax Paid | Tax Assessment Tax Assessment Total Assessment is a certain percentage of the fair market value that is determined by local assessors to be the total taxable value of land and additions on the property. | Land | Improvement |
|---|---|---|---|---|
| 2025 | $2,414 | $232,100 | $89,121 | $142,979 |
| 2024 | $2,339 | $226,051 | $97,620 | $128,431 |
| 2023 | $2,147 | $384,000 | $111,669 | $272,331 |
| 2022 | $2,279 | $225,500 | $67,574 | $157,926 |
| 2021 | $0 | $309,000 | $85,838 | $223,162 |
| 2020 | $1,928 | $280,000 | $73,604 | $206,396 |
| 2019 | $1,846 | $262,000 | $84,781 | $177,219 |
| 2018 | $1,714 | $239,000 | $71,450 | $167,550 |
| 2016 | $1,402 | $100,925 | $27,961 | $72,964 |
| 2015 | $1,218 | $83,380 | $27,961 | $55,419 |
| 2014 | $1,182 | $82,187 | $27,961 | $54,226 |
| 2013 | -- | $77,113 | $27,143 | $49,970 |
Source: Public Records
Map
Nearby Homes