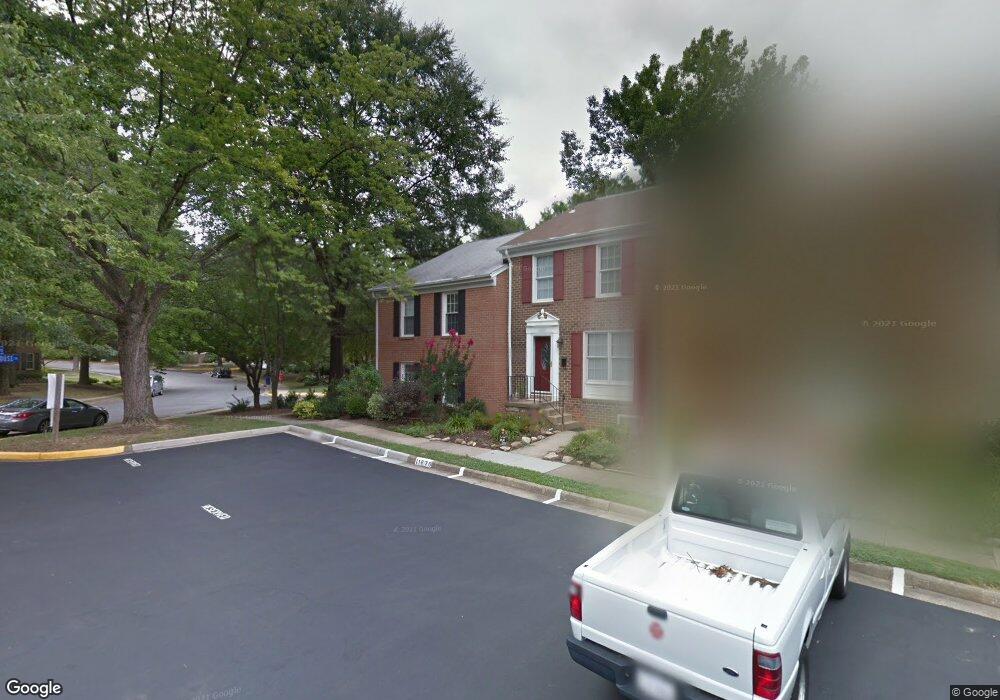
11878 Dunlop Ct Reston, VA 20191
Estimated Value: $629,000 - $649,000
4
Beds
3
Baths
2,376
Sq Ft
$269/Sq Ft
Est. Value
About This Home
This home is located at 11878 Dunlop Ct, Reston, VA 20191 and is currently estimated at $639,000, approximately $268 per square foot. 11878 Dunlop Ct is a home located in Fairfax County with nearby schools including Hunters Woods Elementary, South Lakes High School, and Al Fatih Academy.
Ownership History
Date
Name
Owned For
Owner Type
Purchase Details
Closed on
Aug 22, 2024
Sold by
Mattei Craig J
Bought by
Craig J Mattei Living Trust and Mattei
Current Estimated Value
Purchase Details
Closed on
Mar 21, 2019
Sold by
Mattei Craig and Mattei Danielle
Bought by
Mattei Craig
Home Financials for this Owner
Home Financials are based on the most recent Mortgage that was taken out on this home.
Original Mortgage
$263,000
Interest Rate
3.5%
Mortgage Type
New Conventional
Purchase Details
Closed on
Aug 9, 2010
Sold by
Weiss Gregg H
Bought by
Mattei Craig J
Home Financials for this Owner
Home Financials are based on the most recent Mortgage that was taken out on this home.
Original Mortgage
$308,000
Interest Rate
4.63%
Mortgage Type
New Conventional
Purchase Details
Closed on
Aug 29, 2002
Sold by
Stallone John
Bought by
Stallone Allison
Home Financials for this Owner
Home Financials are based on the most recent Mortgage that was taken out on this home.
Original Mortgage
$165,000
Interest Rate
6.27%
Create a Home Valuation Report for This Property
The Home Valuation Report is an in-depth analysis detailing your home's value as well as a comparison with similar homes in the area
Home Values in the Area
Average Home Value in this Area
Purchase History
| Date | Buyer | Sale Price | Title Company |
|---|---|---|---|
| Craig J Mattei Living Trust | -- | None Listed On Document | |
| Mattei Craig | -- | Property Title & Escrow Llc | |
| Mattei Craig J | $385,000 | -- | |
| Stallone Allison | $165,000 | -- |
Source: Public Records
Mortgage History
| Date | Status | Borrower | Loan Amount |
|---|---|---|---|
| Previous Owner | Mattei Craig | $263,000 | |
| Previous Owner | Mattei Craig J | $308,000 | |
| Previous Owner | Stallone Allison | $165,000 |
Source: Public Records
Tax History Compared to Growth
Tax History
| Year | Tax Paid | Tax Assessment Tax Assessment Total Assessment is a certain percentage of the fair market value that is determined by local assessors to be the total taxable value of land and additions on the property. | Land | Improvement |
|---|---|---|---|---|
| 2025 | $6,753 | $587,490 | $205,000 | $382,490 |
| 2024 | $6,753 | $560,160 | $190,000 | $370,160 |
| 2023 | $6,125 | $521,080 | $170,000 | $351,080 |
| 2022 | $5,887 | $494,490 | $160,000 | $334,490 |
| 2021 | $5,532 | $453,290 | $130,000 | $323,290 |
| 2020 | $5,332 | $433,330 | $115,000 | $318,330 |
| 2019 | $5,111 | $415,340 | $115,000 | $300,340 |
| 2018 | $4,703 | $408,960 | $110,000 | $298,960 |
| 2017 | $4,940 | $408,960 | $110,000 | $298,960 |
| 2016 | $4,768 | $395,500 | $105,000 | $290,500 |
| 2015 | $4,479 | $385,150 | $97,000 | $288,150 |
| 2014 | $4,314 | $371,760 | $92,000 | $279,760 |
Source: Public Records
Map
Nearby Homes
- 2300 Horseferry Ct
- 11751 Mossy Creek Ln
- 11837 Shire Ct Unit 22C
- 11813 Breton Ct Unit 1A
- 11709 Karbon Hill Ct Unit 606A
- 11808 Breton Ct Unit 12C
- 11721 Karbon Hill Ct Unit T2
- 2233 Lovedale Ln Unit I
- 11813 Triple Crown Rd
- 11824 Breton Ct Unit 24A
- 11879 Barrel Cooper Ct
- 11659 Stoneview Square Unit 99/1B
- 11817 Coopers Ct
- 11908 Barrel Cooper Ct
- 11735 Ledura Ct Unit 201
- 11657 Stoneview Square Unit 97/22C
- 2376 Generation Dr
- 2369 Generation Dr
- 2142 Cartwright Place
- 2118 Green Watch Way Unit 10/201C
- 11876 Dunlop Ct
- 11874 Dunlop Ct
- 11872 Dunlop Ct
- 2359 Horseferry Ct
- 11870 Dunlop Ct
- 2357 Horseferry Ct
- 11868 Dunlop Ct
- 2355 Horseferry Ct
- 2360 Horseferry Ct
- 11866 Dunlop Ct
- 2358 Horseferry Ct
- 2353 Horseferry Ct
- 11840 Dunlop Ct
- 11864 Dunlop Ct
- 2356 Horseferry Ct
- 2351 Horseferry Ct
- 2315 Duke of Bedford Ct
- 2354 Horseferry Ct
- 11862 Dunlop Ct
- 11842 Dunlop Ct