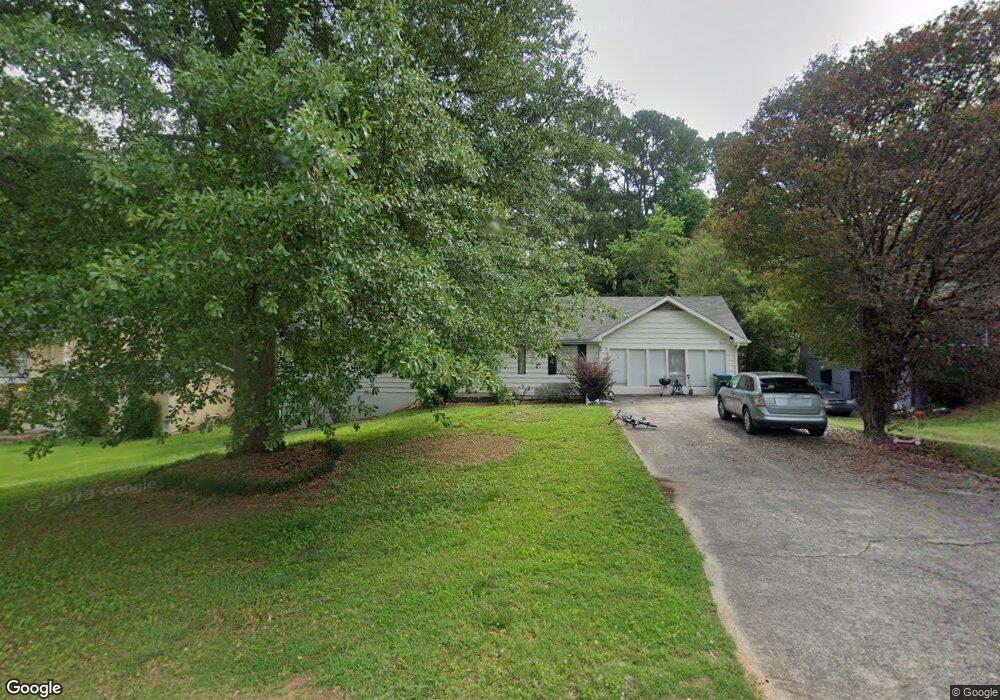
1188 Carla Joe Dr SW Unit 3 Lilburn, GA 30047
Estimated Value: $372,000 - $429,000
3
Beds
2
Baths
2,014
Sq Ft
$200/Sq Ft
Est. Value
About This Home
This home is located at 1188 Carla Joe Dr SW Unit 3, Lilburn, GA 30047 and is currently estimated at $403,323, approximately $200 per square foot. 1188 Carla Joe Dr SW Unit 3 is a home located in Gwinnett County with nearby schools including Camp Creek Elementary School, Trickum Middle School, and Parkview High School.
Ownership History
Date
Name
Owned For
Owner Type
Purchase Details
Closed on
Sep 7, 2012
Sold by
Godoy Jorge
Bought by
Pham Tuyen
Current Estimated Value
Home Financials for this Owner
Home Financials are based on the most recent Mortgage that was taken out on this home.
Original Mortgage
$51,700
Outstanding Balance
$38,237
Interest Rate
5.25%
Mortgage Type
New Conventional
Estimated Equity
$365,086
Purchase Details
Closed on
Jun 27, 2012
Sold by
State Bank & Trust Co
Bought by
Godoy Jorge
Purchase Details
Closed on
Sep 1, 2009
Sold by
T-Lea Properties Ii Llc
Bought by
State Bk & Trust Co
Purchase Details
Closed on
Mar 3, 2008
Sold by
Stallworth Irvin B and Stallworth Tamara L
Bought by
T-Lea Properties Ii Llc
Home Financials for this Owner
Home Financials are based on the most recent Mortgage that was taken out on this home.
Original Mortgage
$75,000
Interest Rate
5.62%
Create a Home Valuation Report for This Property
The Home Valuation Report is an in-depth analysis detailing your home's value as well as a comparison with similar homes in the area
Home Values in the Area
Average Home Value in this Area
Purchase History
| Date | Buyer | Sale Price | Title Company |
|---|---|---|---|
| Pham Tuyen | $94,000 | -- | |
| Godoy Jorge | $47,000 | -- | |
| State Bk & Trust Co | $75,000 | -- | |
| T-Lea Properties Ii Llc | -- | -- |
Source: Public Records
Mortgage History
| Date | Status | Borrower | Loan Amount |
|---|---|---|---|
| Open | Pham Tuyen | $51,700 | |
| Previous Owner | T-Lea Properties Ii Llc | $75,000 |
Source: Public Records
Tax History Compared to Growth
Tax History
| Year | Tax Paid | Tax Assessment Tax Assessment Total Assessment is a certain percentage of the fair market value that is determined by local assessors to be the total taxable value of land and additions on the property. | Land | Improvement |
|---|---|---|---|---|
| 2025 | $6,201 | $165,440 | $22,200 | $143,240 |
| 2024 | $6,317 | $166,920 | $22,200 | $144,720 |
| 2023 | $6,317 | $146,280 | $24,560 | $121,720 |
| 2022 | $3,134 | $124,960 | $22,400 | $102,560 |
| 2021 | $2,773 | $105,080 | $19,600 | $85,480 |
| 2020 | $2,579 | $95,000 | $14,400 | $80,600 |
| 2019 | $2,548 | $95,000 | $14,400 | $80,600 |
| 2018 | $1,761 | $79,560 | $14,400 | $65,160 |
| 2016 | $1,741 | $56,560 | $8,000 | $48,560 |
| 2015 | $1,748 | $56,560 | $8,000 | $48,560 |
| 2014 | -- | $56,560 | $8,000 | $48,560 |
Source: Public Records
Map
Nearby Homes
- 1178 Carla Joe Dr SW
- 1276 Hickory Dr SW
- 1337 Arlene Ct SW
- 1296 Lake Lucerne Rd SW
- 1348 Ridgewood Dr SW
- 4665 Redspruce Dr SW
- 1296 Mandalay Ct SW
- 450 Rockfern Ct
- 460 Rockfern Ct Unit 14A
- 1075 Westchester Dr SW
- 954 Camp Creek Dr SW
- 1017 Rolling Forest Ln
- 5002 Abbey Ln SW
- 1461 Fox Forest Terrace SW
- 4327 Saint Michaels Dr SW
- 1527 Ridgewood Dr SW
- 1188 Carla Joe Dr SW
- 1192 Carla Joe Dr SW
- 4669 Five Forks Trickum Rd SW
- 1168 Carla Joe Dr SW
- 1189 Carla Joe Dr SW Unit 1
- 1189 Carla Joe Dr SW
- 1179 Carla Joe Dr SW
- 1199 Carla Joe Dr SW
- 1158 Carla Joe Dr SW
- 1185 Parkview Way SW
- 1201 Stephens St SW
- 1195 Parkview Way SW Unit 1
- 1169 Carla Joe Dr SW
- 1165 Parkview Way SW
- 1202 Stephens St SW
- 1148 Carla Joe Dr SW
- 1159 Carla Joe Dr SW
- 1211 Stephens St SW
- 1212 Stephens St SW
- 1149 Carla Joe Dr SW