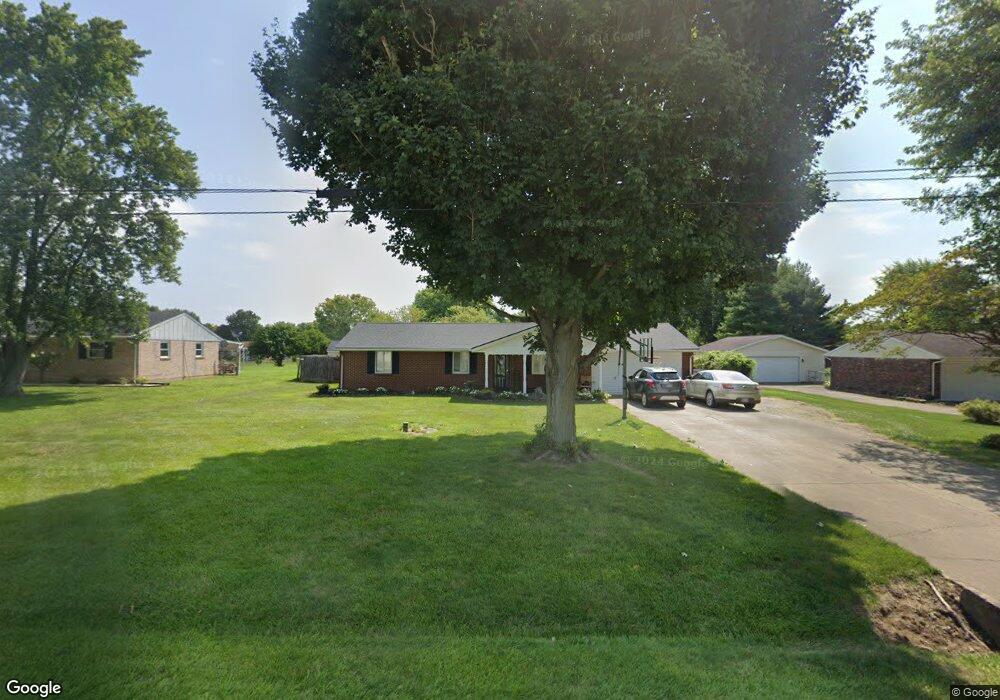
1188 Dafler Rd West Alexandria, OH 45381
Estimated Value: $192,000 - $208,000
3
Beds
2
Baths
1,092
Sq Ft
$182/Sq Ft
Est. Value
About This Home
This home is located at 1188 Dafler Rd, West Alexandria, OH 45381 and is currently estimated at $198,772, approximately $182 per square foot. 1188 Dafler Rd is a home located in Preble County with nearby schools including Twin Valley South Elementary School, Twin Valley South Middle School, and Twin Valley South High School.
Ownership History
Date
Name
Owned For
Owner Type
Purchase Details
Closed on
Apr 12, 2018
Sold by
Mabry Jacob M and Mabry Amity M
Bought by
Horn James M and Horn Jennifer C
Current Estimated Value
Home Financials for this Owner
Home Financials are based on the most recent Mortgage that was taken out on this home.
Original Mortgage
$98,188
Outstanding Balance
$84,557
Interest Rate
4.5%
Mortgage Type
FHA
Estimated Equity
$114,215
Purchase Details
Closed on
Dec 12, 2012
Sold by
Spratt Gregroy D and Spratt Ginger K
Bought by
Cole Austin M and Voge Lindsey M
Home Financials for this Owner
Home Financials are based on the most recent Mortgage that was taken out on this home.
Original Mortgage
$61,750
Interest Rate
3.36%
Mortgage Type
New Conventional
Purchase Details
Closed on
Mar 21, 2006
Sold by
Bowman Audra P
Bought by
Spratt Gregory D and Spratt Ginger K
Purchase Details
Closed on
Jun 15, 1984
Bought by
Cole Austin M @2 Voge Lindsey M
Create a Home Valuation Report for This Property
The Home Valuation Report is an in-depth analysis detailing your home's value as well as a comparison with similar homes in the area
Home Values in the Area
Average Home Value in this Area
Purchase History
| Date | Buyer | Sale Price | Title Company |
|---|---|---|---|
| Horn James M | $100,000 | Freedom Title Company | |
| Cole Austin M | $65,000 | None Available | |
| Spratt Gregory D | -- | None Available | |
| Cole Austin M @2 Voge Lindsey M | $45,000 | -- |
Source: Public Records
Mortgage History
| Date | Status | Borrower | Loan Amount |
|---|---|---|---|
| Open | Horn James M | $98,188 | |
| Previous Owner | Cole Austin M | $61,750 |
Source: Public Records
Tax History Compared to Growth
Tax History
| Year | Tax Paid | Tax Assessment Tax Assessment Total Assessment is a certain percentage of the fair market value that is determined by local assessors to be the total taxable value of land and additions on the property. | Land | Improvement |
|---|---|---|---|---|
| 2024 | $1,695 | $47,890 | $6,480 | $41,410 |
| 2023 | $1,695 | $47,890 | $6,480 | $41,410 |
| 2022 | $1,299 | $34,340 | $4,130 | $30,210 |
| 2021 | $1,404 | $34,340 | $4,130 | $30,210 |
| 2020 | $1,347 | $34,340 | $4,130 | $30,210 |
| 2019 | $1,195 | $29,620 | $3,610 | $26,010 |
| 2018 | $1,235 | $29,620 | $3,610 | $26,010 |
| 2017 | $1,026 | $27,660 | $3,610 | $24,050 |
| 2016 | $896 | $23,240 | $3,500 | $19,740 |
| 2014 | $1,162 | $23,240 | $3,500 | $19,740 |
| 2013 | $1,162 | $28,805 | $3,500 | $25,305 |
Source: Public Records
Map
Nearby Homes
- 1389 Leon Dr
- 3659 Winston Ln
- 10 Western Dr
- 4801 Fisher Twin Rd
- 60 Hope Ave
- 1020 Howard Ct
- 37 Smith St
- 0 U S 35
- 52 E 2nd St
- 36 E 3rd St
- 212 E 3rd St
- 1148 State Route 503 N
- 0 State Rt 35 Unit 935251
- 6762 U S 35
- 3292 Twin Creek Rd
- 99 Katherine Dr
- 86 Snapdragon Dr
- The Heath House Plan at Meadowbrook Estates
- The Aspen House Plan at Meadowbrook Estates
- The Reed II House Plan at Meadowbrook Estates