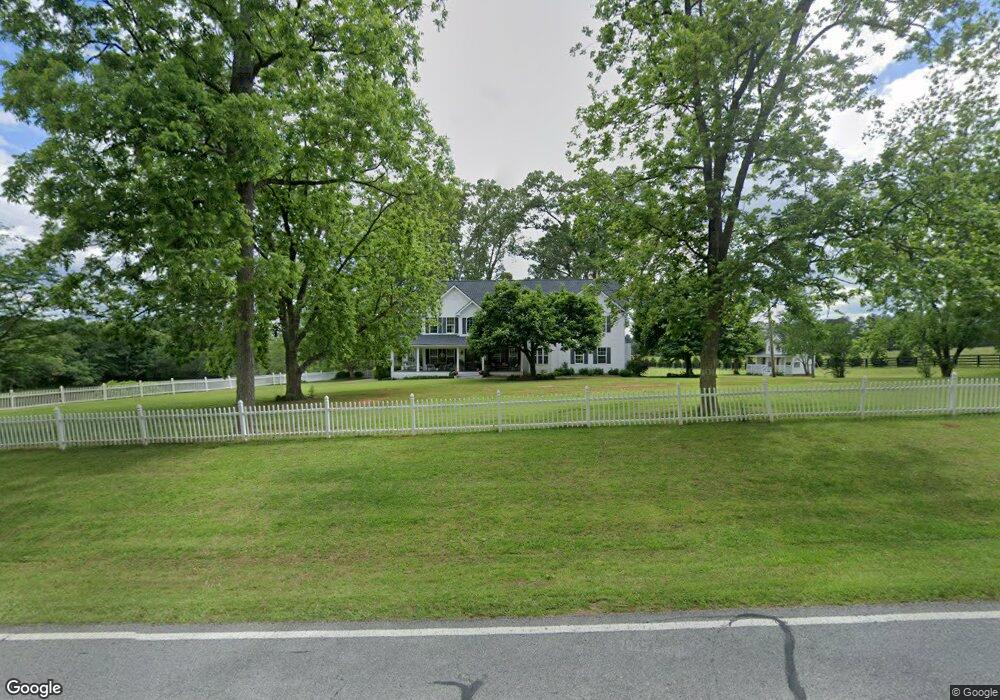
1188 Welcome Rd Newnan, GA 30263
Estimated Value: $487,000 - $929,000
8
Beds
7
Baths
5,990
Sq Ft
$124/Sq Ft
Est. Value
About This Home
This home is located at 1188 Welcome Rd, Newnan, GA 30263 and is currently estimated at $744,144, approximately $124 per square foot. 1188 Welcome Rd is a home located in Coweta County with nearby schools including Western Elementary School, Evans Middle School, and Newnan High School.
Ownership History
Date
Name
Owned For
Owner Type
Purchase Details
Closed on
Aug 22, 2014
Sold by
Brown Christina Neely
Bought by
Brown Robert D and Brown Christina Neely
Current Estimated Value
Home Financials for this Owner
Home Financials are based on the most recent Mortgage that was taken out on this home.
Original Mortgage
$375,000
Outstanding Balance
$286,895
Interest Rate
4.2%
Mortgage Type
New Conventional
Estimated Equity
$457,249
Purchase Details
Closed on
Sep 10, 2013
Sold by
Neely Steven M
Bought by
Brown Christina Neely
Purchase Details
Closed on
Jun 23, 1998
Sold by
Harris Stephen A and Harris Frances T
Bought by
Neely Steven M and Neely Christina F
Home Financials for this Owner
Home Financials are based on the most recent Mortgage that was taken out on this home.
Original Mortgage
$120,000
Interest Rate
7.04%
Mortgage Type
New Conventional
Purchase Details
Closed on
Jul 28, 1992
Bought by
Harris Stephen A and Harris F
Purchase Details
Closed on
May 31, 1986
Bought by
Shirey Frances H
Create a Home Valuation Report for This Property
The Home Valuation Report is an in-depth analysis detailing your home's value as well as a comparison with similar homes in the area
Home Values in the Area
Average Home Value in this Area
Purchase History
| Date | Buyer | Sale Price | Title Company |
|---|---|---|---|
| Brown Robert D | -- | -- | |
| Brown Christina Neely | -- | -- | |
| Neely Steven M | $150,000 | -- | |
| Harris Stephen A | $152,000 | -- | |
| Shirey Frances H | -- | -- | |
| Shirey Frances H | -- | -- |
Source: Public Records
Mortgage History
| Date | Status | Borrower | Loan Amount |
|---|---|---|---|
| Open | Brown Robert D | $375,000 | |
| Previous Owner | Neely Steven M | $120,000 |
Source: Public Records
Tax History Compared to Growth
Tax History
| Year | Tax Paid | Tax Assessment Tax Assessment Total Assessment is a certain percentage of the fair market value that is determined by local assessors to be the total taxable value of land and additions on the property. | Land | Improvement |
|---|---|---|---|---|
| 2024 | $5,219 | $267,937 | $29,512 | $238,425 |
| 2023 | $5,219 | $269,798 | $27,125 | $242,673 |
| 2022 | $5,107 | $211,998 | $23,184 | $188,814 |
| 2021 | $5,032 | $195,830 | $22,080 | $173,750 |
| 2020 | $5,065 | $195,830 | $22,080 | $173,750 |
| 2019 | $4,749 | $167,045 | $18,404 | $148,640 |
| 2018 | $4,758 | $167,045 | $18,404 | $148,640 |
| 2017 | $4,756 | $167,045 | $18,404 | $148,641 |
| 2016 | $4,701 | $167,045 | $18,404 | $148,640 |
| 2015 | $4,624 | $167,045 | $18,404 | $148,640 |
| 2014 | $4,590 | $167,045 | $18,404 | $148,640 |
Source: Public Records
Map
Nearby Homes
- 1268 Welcome Rd
- 1428 Welcome Rd
- 0 Welcome To Arnco Rd Unit 21222787
- 0 Welcome To Arnco Rd Unit 10350112
- 2 Mount Carmel Rd
- 460 Welcome To Arnco Rd
- 147 Sheppard Dr
- 460 Welcome To Arnco Rd
- 15 Meadowview Ln
- 175 Thigpen Rd
- 195 Frances Shirey Way
- 572 Austin Rd
- 980 Providence Church Rd
- 77 Shelnut Way
- 606 Welcome Sargent Rd
- 22 Clemit Harris Rd Unit LOT 22
- 20 Sunflower Dr
- 199 Sagebrook Ln
- 0 Ga Hwy 34 W Unit 21 10564723
- 2058 Welcome Rd
- 1209 Welcome Rd
- 16 Welcome To Arnco Rd
- 1219 Welcome Rd
- 1145 Welcome Rd
- 1237 Welcome Rd
- 690 Thigpen Rd
- 47 Welcome Arnco Rd
- 1214 Welcome Rd
- 1266 Welcome Rd
- 39 Kee Rd
- 1265 Welcome Rd
- LOT 17 Welcome Rd
- 00 Welcome Rd
- 63 Welcome To Arnco Rd
- 675 Thigpen Rd
- 0 Kee Rd Unit 7324265
- 61 Kee Rd
- 61 Hall Cir
- 1283 Welcome Rd
- 58 Kee Rd