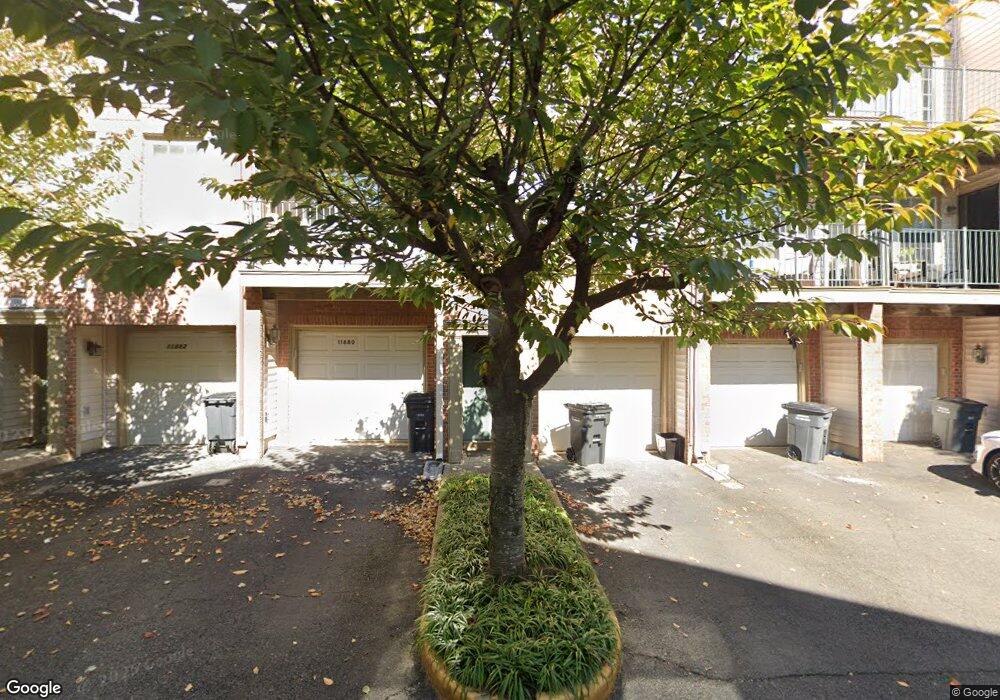
11886 Breton Ct Unit 9B Reston, VA 20191
Estimated Value: $497,000
2
Beds
3
Baths
1,524
Sq Ft
$326/Sq Ft
Est. Value
About This Home
This home is located at 11886 Breton Ct Unit 9B, Reston, VA 20191 and is currently estimated at $497,000, approximately $326 per square foot. 11886 Breton Ct Unit 9B is a home located in Fairfax County with nearby schools including Hunters Woods Elementary, South Lakes High School, and Al Fatih Academy.
Ownership History
Date
Name
Owned For
Owner Type
Purchase Details
Closed on
Mar 4, 2024
Sold by
Chang Jungjin
Bought by
Carter Investments
Current Estimated Value
Purchase Details
Closed on
Feb 26, 2024
Sold by
Wilmer Anna J
Bought by
Bainton William and Bainton Anna Jurjevna
Purchase Details
Closed on
Aug 25, 2009
Sold by
Wang Franklin
Bought by
Wilmer Anna J
Home Financials for this Owner
Home Financials are based on the most recent Mortgage that was taken out on this home.
Original Mortgage
$277,600
Interest Rate
5.17%
Mortgage Type
Purchase Money Mortgage
Purchase Details
Closed on
Aug 24, 2005
Sold by
Quigley James
Bought by
Wang Franklin
Home Financials for this Owner
Home Financials are based on the most recent Mortgage that was taken out on this home.
Original Mortgage
$319,920
Interest Rate
5.68%
Mortgage Type
Purchase Money Mortgage
Create a Home Valuation Report for This Property
The Home Valuation Report is an in-depth analysis detailing your home's value as well as a comparison with similar homes in the area
Home Values in the Area
Average Home Value in this Area
Purchase History
| Date | Buyer | Sale Price | Title Company |
|---|---|---|---|
| Carter Investments | $219,000 | First American Title | |
| Bainton William | -- | None Listed On Document | |
| Wilmer Anna J | $347,000 | -- | |
| Wang Franklin | $399,900 | -- |
Source: Public Records
Mortgage History
| Date | Status | Borrower | Loan Amount |
|---|---|---|---|
| Previous Owner | Wilmer Anna J | $277,600 | |
| Previous Owner | Wang Franklin | $319,920 |
Source: Public Records
Tax History Compared to Growth
Tax History
| Year | Tax Paid | Tax Assessment Tax Assessment Total Assessment is a certain percentage of the fair market value that is determined by local assessors to be the total taxable value of land and additions on the property. | Land | Improvement |
|---|---|---|---|---|
| 2025 | $5,277 | $464,000 | $93,000 | $371,000 |
| 2024 | $5,277 | $437,740 | $88,000 | $349,740 |
| 2023 | $4,809 | $409,100 | $82,000 | $327,100 |
| 2022 | $4,595 | $385,940 | $77,000 | $308,940 |
| 2021 | $4,618 | $378,370 | $76,000 | $302,370 |
| 2020 | $4,271 | $347,130 | $69,000 | $278,130 |
| 2019 | $4,131 | $335,720 | $67,000 | $268,720 |
| 2018 | $3,861 | $335,720 | $67,000 | $268,720 |
| 2017 | $4,138 | $342,570 | $69,000 | $273,570 |
| 2016 | $4,130 | $342,570 | $69,000 | $273,570 |
| 2015 | $3,729 | $320,610 | $64,000 | $256,610 |
| 2014 | $3,721 | $320,610 | $64,000 | $256,610 |
Source: Public Records
Map
Nearby Homes
- 11824 Breton Ct Unit 24A
- 11808 Breton Ct Unit 12C
- 11813 Breton Ct Unit 1A
- 11837 Shire Ct Unit 22C
- 2273 Hunters Run Dr
- 2418 Ridgehampton Ct
- 11908 Barrel Cooper Ct
- 2203 Hunters Run Dr
- 11879 Barrel Cooper Ct
- 2300 Horseferry Ct
- 11817 Coopers Ct
- 2142 Cartwright Place
- 2394 Southgate Square
- 2065 Royal Fern Ct Unit 38/12B
- 11721 Karbon Hill Ct Unit T2
- 11735 Ledura Ct Unit 201
- 11709 Karbon Hill Ct Unit 606A
- 11751 Mossy Creek Ln
- 2420 Freetown Dr
- 2042 Royal Fern Ct Unit 1B
- 11882 Breton Ct Unit 10B
- 11882 Breton Ct
- 11878 Breton Ct
- 11876 Breton Ct Unit 11A
- 11872 Breton Ct Unit 12A
- 11874 Breton Ct Unit 12B
- 11886 Breton Ct
- 11884 Breton Ct
- 11880 Breton Ct
- 11876 Breton Ct
- 11874 Breton Ct
- 11872 Breton Ct
- 11868 Breton Ct Unit 13A
- 11858 Breton Ct Unit 16B
- 11868 Breton Ct
- 11858 Breton Ct
- 11856 Breton Ct
- 11864 Breton Ct
- 11862 Breton Ct
- 11870 Breton Ct