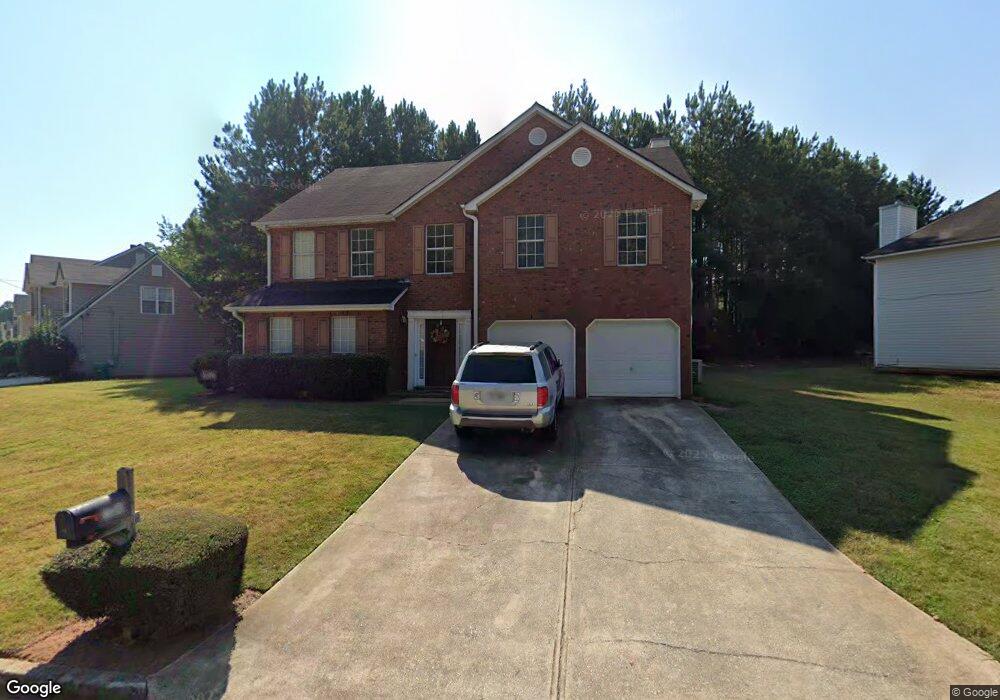
1189 Carriage Trace Cir Unit 2 Stone Mountain, GA 30087
Estimated Value: $324,954 - $340,000
4
Beds
3
Baths
2,394
Sq Ft
$138/Sq Ft
Est. Value
About This Home
This home is located at 1189 Carriage Trace Cir Unit 2, Stone Mountain, GA 30087 and is currently estimated at $331,489, approximately $138 per square foot. 1189 Carriage Trace Cir Unit 2 is a home located in DeKalb County with nearby schools including Pine Ridge Elementary School, Stephenson Middle School, and Stephenson High School.
Ownership History
Date
Name
Owned For
Owner Type
Purchase Details
Closed on
Jul 7, 2022
Sold by
Sfr Jv 2 Property Llc
Bought by
Sfr Jv 2 2022 2 Borrower Llc
Current Estimated Value
Purchase Details
Closed on
Jan 5, 2022
Sold by
Wilson Khalilah R
Bought by
Sfr Jv 2 Property Llc
Purchase Details
Closed on
Feb 16, 2005
Sold by
Mers
Bought by
Wilson Khalilah R
Home Financials for this Owner
Home Financials are based on the most recent Mortgage that was taken out on this home.
Original Mortgage
$136,700
Interest Rate
5.12%
Mortgage Type
New Conventional
Purchase Details
Closed on
Aug 3, 2004
Sold by
Mcclendon Mary A
Bought by
Mtg Elctrn Registration Sys In
Purchase Details
Closed on
Aug 20, 1999
Sold by
Eastland Homes Inc
Bought by
Mcclendon Mary A
Home Financials for this Owner
Home Financials are based on the most recent Mortgage that was taken out on this home.
Original Mortgage
$130,600
Interest Rate
7.91%
Mortgage Type
FHA
Create a Home Valuation Report for This Property
The Home Valuation Report is an in-depth analysis detailing your home's value as well as a comparison with similar homes in the area
Home Values in the Area
Average Home Value in this Area
Purchase History
| Date | Buyer | Sale Price | Title Company |
|---|---|---|---|
| Sfr Jv 2 2022 2 Borrower Llc | -- | -- | |
| Sfr Jv 2 Property Llc | $280,000 | -- | |
| Sfr Jv 2 Property Llc | $280,000 | -- | |
| Wilson Khalilah R | $147,000 | -- | |
| Mtg Elctrn Registration Sys In | $162,476 | -- | |
| Mcclendon Mary A | $134,500 | -- |
Source: Public Records
Mortgage History
| Date | Status | Borrower | Loan Amount |
|---|---|---|---|
| Previous Owner | Wilson Khalilah R | $136,700 | |
| Previous Owner | Mcclendon Mary A | $130,600 |
Source: Public Records
Tax History Compared to Growth
Tax History
| Year | Tax Paid | Tax Assessment Tax Assessment Total Assessment is a certain percentage of the fair market value that is determined by local assessors to be the total taxable value of land and additions on the property. | Land | Improvement |
|---|---|---|---|---|
| 2025 | $6,413 | $135,120 | $16,214 | $118,906 |
| 2024 | $6,415 | $135,120 | $16,000 | $119,120 |
| 2023 | $6,415 | $112,000 | $13,440 | $98,560 |
| 2022 | $5,042 | $105,720 | $9,680 | $96,040 |
| 2021 | $4,173 | $85,920 | $9,680 | $76,240 |
| 2020 | $3,639 | $73,760 | $9,680 | $64,080 |
| 2019 | $3,323 | $66,560 | $9,680 | $56,880 |
| 2018 | $2,767 | $58,080 | $9,680 | $48,400 |
| 2017 | $2,752 | $53,320 | $9,680 | $43,640 |
| 2016 | $2,768 | $54,120 | $9,680 | $44,440 |
| 2014 | $2,061 | $37,200 | $9,680 | $27,520 |
Source: Public Records
Map
Nearby Homes
- 1246 Carriage Trace Cir
- 1174 Falkirk Ln
- 1148 Falkirk Ln
- 861 Southland Pass
- 860 Southland Pass
- 1001 Pine Ridge Dr
- 1130 Falkirk Ln
- 6280 Lake Valley Point
- 1117 Falkirk Ln
- 6390 Alford Cir
- 6256 Lake Valley Point
- 6261 Lake Valley Point
- 6426 Alford Cir
- 6212 Lake Valley Point
- 6588 Norcliffe Dr
- 6393 Shadow Square
- 579 Shadow Lake Dr
- 6373 Shadow Square
- 1075 Falkirk Ln
- 1062 Valley Rock Dr
- 1203 Carriage Trace Cir
- 1179 Carriage Trace Cir
- 1188 Carriage Trace Cir
- 1209 Carriage Trace Cir Unit 1
- 1192 Carriage Trace Cir Unit 2
- 1171 Carriage Trace Cir
- 6330 Carriage Crossing
- 6334 Carriage Crossing
- 1204 Carriage Trace Cir
- 1184 Carriage Trace Cir
- 1180 Carriage Trace Cir
- 1215 Carriage Trace Cir Unit 1
- 1174 Carriage Trace Cir
- 1161 Carriage Trace Cir
- 1210 Carriage Trace Cir
- 6329 Carriage Crossing
- 1166 Carriage Trace Cir
- 1166 Carriage Trace Cir Unit 2
- 6338 Carriage Crossing
- 1216 Carriage Trace Cir