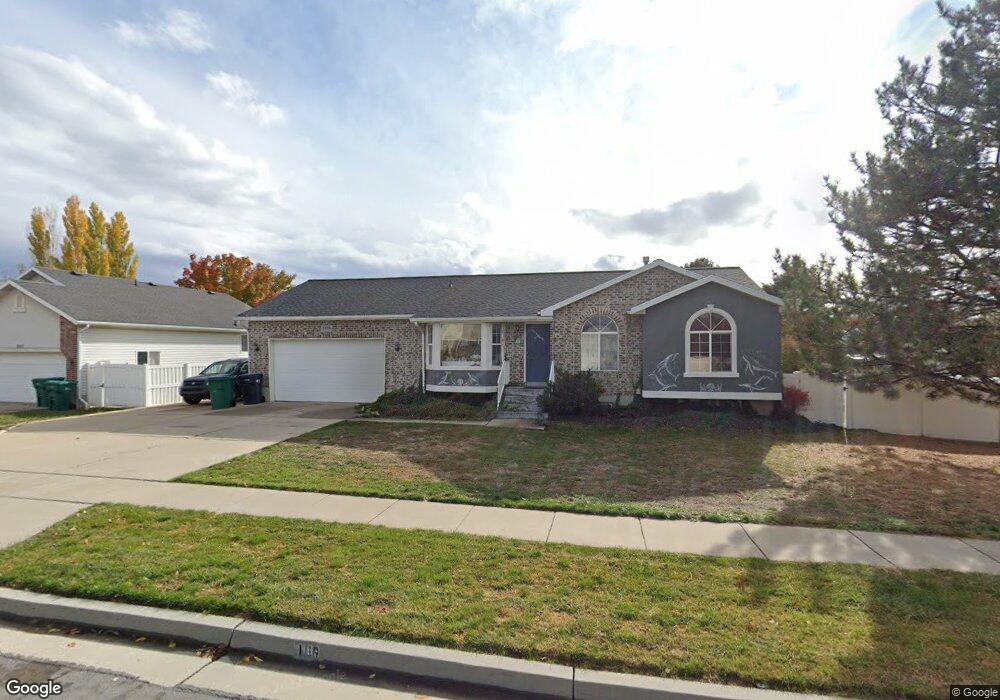
1189 W 275 S Layton, UT 84041
Estimated Value: $498,812 - $527,000
4
Beds
2
Baths
2,508
Sq Ft
$205/Sq Ft
Est. Value
About This Home
This home is located at 1189 W 275 S, Layton, UT 84041 and is currently estimated at $515,203, approximately $205 per square foot. 1189 W 275 S is a home located in Davis County with nearby schools including Layton Elementary School, Fairfield Junior High School, and Layton High School.
Ownership History
Date
Name
Owned For
Owner Type
Purchase Details
Closed on
Dec 31, 2004
Sold by
Farr Mathers H and Farr Mariah S
Bought by
Magee Mark R and Magee Leis K
Current Estimated Value
Home Financials for this Owner
Home Financials are based on the most recent Mortgage that was taken out on this home.
Original Mortgage
$0
Interest Rate
5.74%
Mortgage Type
Unknown
Purchase Details
Closed on
Sep 30, 1999
Sold by
Country West Construction & Real Inc
Bought by
Farr Mathers H and Farr Mariah S
Home Financials for this Owner
Home Financials are based on the most recent Mortgage that was taken out on this home.
Original Mortgage
$127,300
Interest Rate
7.97%
Purchase Details
Closed on
Jun 8, 1999
Sold by
Rkt Holding Company Inc
Bought by
Countrywest Construction Inc
Create a Home Valuation Report for This Property
The Home Valuation Report is an in-depth analysis detailing your home's value as well as a comparison with similar homes in the area
Home Values in the Area
Average Home Value in this Area
Purchase History
| Date | Buyer | Sale Price | Title Company |
|---|---|---|---|
| Magee Mark R | -- | None Available | |
| Farr Mathers H | -- | Bonneville Title Company Inc | |
| Countrywest Construction Inc | -- | First American Title Ins Co |
Source: Public Records
Mortgage History
| Date | Status | Borrower | Loan Amount |
|---|---|---|---|
| Closed | Magee Mark R | $0 | |
| Open | Magee Mark R | $96,000 | |
| Previous Owner | Farr Mathers H | $127,300 |
Source: Public Records
Tax History Compared to Growth
Tax History
| Year | Tax Paid | Tax Assessment Tax Assessment Total Assessment is a certain percentage of the fair market value that is determined by local assessors to be the total taxable value of land and additions on the property. | Land | Improvement |
|---|---|---|---|---|
| 2025 | $2,510 | $263,450 | $113,193 | $150,257 |
| 2024 | $2,408 | $254,650 | $123,539 | $131,111 |
| 2023 | $2,323 | $433,000 | $125,614 | $307,386 |
| 2022 | $2,543 | $257,400 | $76,285 | $181,115 |
| 2021 | $2,252 | $340,000 | $114,435 | $225,565 |
| 2020 | $2,044 | $296,000 | $96,870 | $199,130 |
| 2019 | $1,995 | $283,000 | $98,014 | $184,986 |
| 2018 | $1,924 | $274,000 | $86,118 | $187,882 |
| 2016 | $1,735 | $127,435 | $34,536 | $92,899 |
| 2015 | $1,726 | $120,395 | $34,536 | $85,859 |
| 2014 | $1,885 | $134,403 | $34,536 | $99,867 |
| 2013 | -- | $109,700 | $26,549 | $83,151 |
Source: Public Records
Map
Nearby Homes
- 1015 W 350 S
- 296 S 950 W
- 362 S 950 W
- 557 S Angel St
- 933 W Gentile St
- 562 S 850 W
- 750 W Gentile St
- 1606 W 200 N
- Browning Plan at Amber Fields
- Rhapsody Plan at Amber Fields
- Accord Plan at Amber Fields
- Timpani Plan at Amber Fields
- Octave Plan at Amber Fields
- Tempo Plan at Amber Fields
- Harvard Plan at Amber Fields
- Fortissimo Plan at Amber Fields
- Forte Plan at Amber Fields
- Interlude Plan at Amber Fields
- Concerto Plan at Amber Fields
- Bravo Plan at Amber Fields