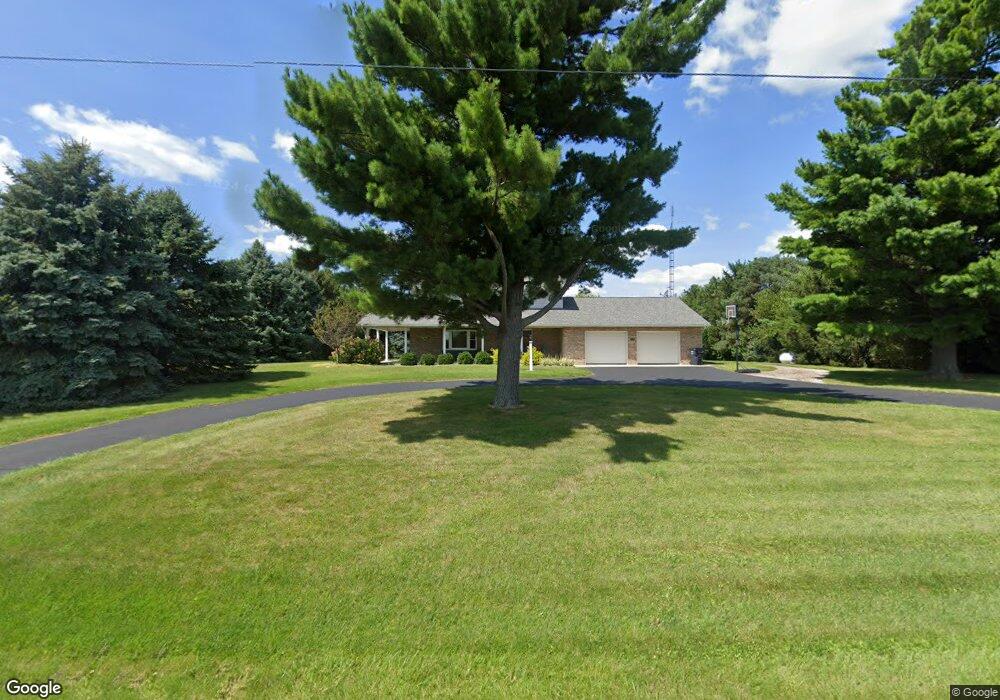
11892 Redridge Rd Columbus Grove, OH 45830
Estimated Value: $298,000 - $365,000
4
Beds
3
Baths
2,458
Sq Ft
$133/Sq Ft
Est. Value
About This Home
This home is located at 11892 Redridge Rd, Columbus Grove, OH 45830 and is currently estimated at $326,314, approximately $132 per square foot. 11892 Redridge Rd is a home with nearby schools including Columbus Grove Elementary School, Columbus Grove Middle School, and Columbus Grove High School.
Ownership History
Date
Name
Owned For
Owner Type
Purchase Details
Closed on
May 31, 2018
Sold by
Langhals Matthew D and Langhals Lisa A
Bought by
Vennekotter John C and Vennekotter Katie A
Current Estimated Value
Home Financials for this Owner
Home Financials are based on the most recent Mortgage that was taken out on this home.
Original Mortgage
$166,400
Outstanding Balance
$143,583
Interest Rate
4.4%
Mortgage Type
Unknown
Estimated Equity
$182,731
Purchase Details
Closed on
May 30, 2018
Sold by
Lamb David L and Lamb Debra E
Bought by
Langhals Matthew D and Langhals Lisa A
Home Financials for this Owner
Home Financials are based on the most recent Mortgage that was taken out on this home.
Original Mortgage
$166,400
Outstanding Balance
$143,583
Interest Rate
4.4%
Mortgage Type
Unknown
Estimated Equity
$182,731
Purchase Details
Closed on
Jul 30, 2009
Sold by
Lamb David L and Lamb Debra E
Bought by
Langhals Matthew D and Langhals Lisa A
Purchase Details
Closed on
Sep 17, 1987
Bought by
Lamb David L
Create a Home Valuation Report for This Property
The Home Valuation Report is an in-depth analysis detailing your home's value as well as a comparison with similar homes in the area
Home Values in the Area
Average Home Value in this Area
Purchase History
| Date | Buyer | Sale Price | Title Company |
|---|---|---|---|
| Vennekotter John C | $208,000 | None Available | |
| Langhals Matthew D | -- | None Available | |
| Langhals Matthew D | $175,000 | None Available | |
| Lamb David L | $7,500 | -- |
Source: Public Records
Mortgage History
| Date | Status | Borrower | Loan Amount |
|---|---|---|---|
| Open | Vennekotter John C | $166,400 |
Source: Public Records
Tax History Compared to Growth
Tax History
| Year | Tax Paid | Tax Assessment Tax Assessment Total Assessment is a certain percentage of the fair market value that is determined by local assessors to be the total taxable value of land and additions on the property. | Land | Improvement |
|---|---|---|---|---|
| 2024 | $2,715 | $91,040 | $9,140 | $81,900 |
| 2023 | $2,413 | $74,620 | $7,490 | $67,130 |
| 2022 | $2,547 | $74,620 | $7,490 | $67,130 |
| 2021 | $2,565 | $74,620 | $7,490 | $67,130 |
| 2020 | $2,078 | $60,410 | $6,790 | $53,620 |
| 2019 | $2,078 | $60,410 | $6,790 | $53,620 |
| 2018 | $2,098 | $60,410 | $6,790 | $53,620 |
| 2017 | $1,947 | $55,550 | $6,790 | $48,760 |
| 2016 | $1,932 | $55,550 | $6,790 | $48,760 |
| 2015 | $2,228 | $55,550 | $6,790 | $48,760 |
| 2014 | $2,228 | $62,230 | $6,790 | $55,440 |
| 2013 | $2,176 | $62,230 | $6,790 | $55,440 |
Source: Public Records
Map
Nearby Homes
- 11059 Ottawa Rd
- 308 Delphos Rd
- 205 S Broadway St
- 204 S Broadway St
- 209 Willow Bend Dr
- 147 Elm St
- 148 S Water St
- 6585 Ottawa Rd
- 201 Wall St
- 309 Wall St
- 300 Sweaney Ave
- 220 Parklane Dr
- 15105 Road 15m
- 2525 W Lincoln Hwy
- 00000 Ohio 696
- 000 Ohio 696
- 0000 Ohio 696
- 4150 W Lincoln Hwy
- 3456 Shearin Ave
- 3798 Kissing Hollow Dr
- 11968 Redridge Rd
- 11846 Redridge Rd
- 11955 State Route 12
- 11985 Redridge Rd
- 11232 Ramsey Rd
- 11150 Ramsey Rd
- 11874 State Route 12
- 11502 State Route 12
- 11477 State Route 12
- 11412 State Route 12
- 10880 Ramsey Rd
- 11389 State Route 12
- 11327 State Route 12
- 12267 Road R11
- 11285 State Route 12
- 10720 Ramsey Rd
- 18360 Road 11r
- 11245 State Route 12
- 18294 Road 11r