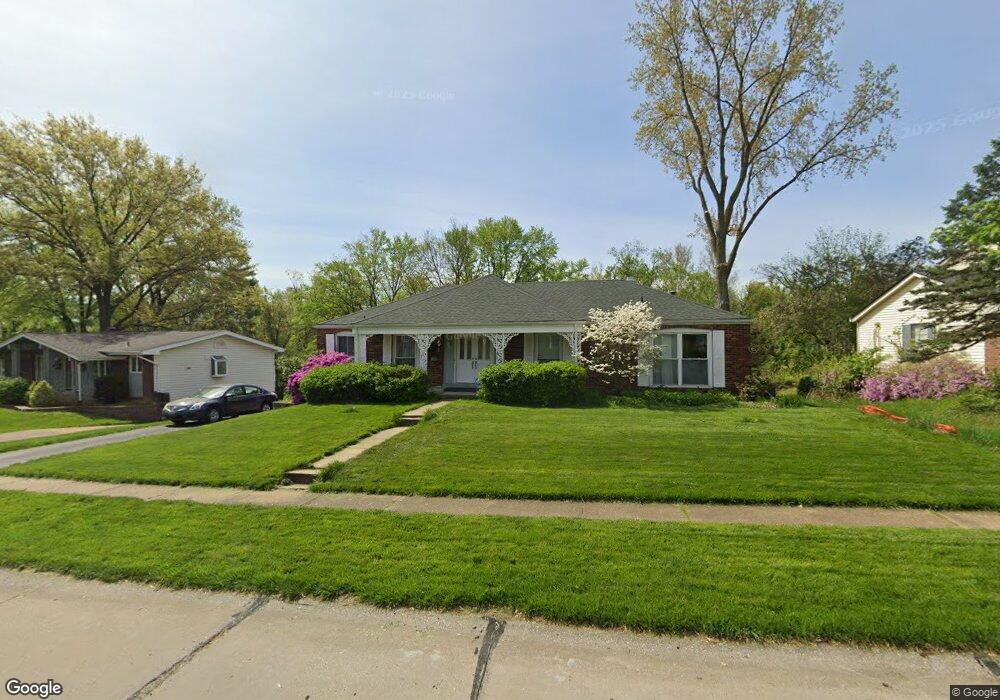
11894 Shallowbrook Dr Saint Louis, MO 63146
Estimated Value: $345,000 - $371,203
5
Beds
4
Baths
1,628
Sq Ft
$223/Sq Ft
Est. Value
About This Home
This home is located at 11894 Shallowbrook Dr, Saint Louis, MO 63146 and is currently estimated at $363,551, approximately $223 per square foot. 11894 Shallowbrook Dr is a home located in St. Louis County with nearby schools including Craig Elementary School, Parkway Northeast Middle School, and Parkway North High School.
Ownership History
Date
Name
Owned For
Owner Type
Purchase Details
Closed on
Apr 25, 2005
Sold by
Sirva Relocation Llc
Bought by
Vendrov Yevgeniy A and Denissova Marina N
Current Estimated Value
Home Financials for this Owner
Home Financials are based on the most recent Mortgage that was taken out on this home.
Original Mortgage
$40,000
Interest Rate
5.87%
Mortgage Type
Fannie Mae Freddie Mac
Purchase Details
Closed on
Jun 4, 2001
Sold by
Potts Ann J and Potts Garth
Bought by
Strednansky John and Ormsby Rebecca L
Home Financials for this Owner
Home Financials are based on the most recent Mortgage that was taken out on this home.
Original Mortgage
$151,200
Interest Rate
7.1%
Purchase Details
Closed on
Apr 18, 2001
Sold by
Janklow Bernard M
Bought by
Hadley Ann J
Home Financials for this Owner
Home Financials are based on the most recent Mortgage that was taken out on this home.
Original Mortgage
$151,200
Interest Rate
7.1%
Create a Home Valuation Report for This Property
The Home Valuation Report is an in-depth analysis detailing your home's value as well as a comparison with similar homes in the area
Home Values in the Area
Average Home Value in this Area
Purchase History
| Date | Buyer | Sale Price | Title Company |
|---|---|---|---|
| Vendrov Yevgeniy A | $255,000 | Clt | |
| Sirva Relocation Llc | $255,000 | Clt | |
| Strednansky John | $189,000 | -- | |
| Strednansky John | -- | -- | |
| Hadley Ann J | -- | -- |
Source: Public Records
Mortgage History
| Date | Status | Borrower | Loan Amount |
|---|---|---|---|
| Closed | Vendrov Yevgeniy A | $40,000 | |
| Previous Owner | Strednansky John | $151,200 | |
| Closed | Vendrov Yevgeniy A | $60,000 |
Source: Public Records
Tax History Compared to Growth
Tax History
| Year | Tax Paid | Tax Assessment Tax Assessment Total Assessment is a certain percentage of the fair market value that is determined by local assessors to be the total taxable value of land and additions on the property. | Land | Improvement |
|---|---|---|---|---|
| 2025 | $4,323 | $64,980 | $32,070 | $32,910 |
| 2024 | $4,323 | $66,110 | $21,380 | $44,730 |
| 2023 | $4,268 | $66,110 | $21,380 | $44,730 |
| 2022 | $3,640 | $51,360 | $21,380 | $29,980 |
| 2021 | $3,615 | $51,360 | $21,380 | $29,980 |
| 2020 | $3,419 | $46,380 | $20,240 | $26,140 |
| 2019 | $3,365 | $46,380 | $20,240 | $26,140 |
| 2018 | $3,235 | $41,150 | $17,800 | $23,350 |
| 2017 | $3,212 | $41,150 | $17,800 | $23,350 |
| 2016 | $3,057 | $37,240 | $14,250 | $22,990 |
| 2015 | $3,187 | $37,240 | $14,250 | $22,990 |
| 2014 | $2,989 | $37,320 | $8,340 | $28,980 |
Source: Public Records
Map
Nearby Homes
- 11825 Villa Dorado Dr
- 11983 Villa Dorado Dr Unit 211
- 11921 Villa Dorado Dr Unit A
- 11741 Casa Grande Dr Unit G
- 11714 Casa Grande Dr
- 11861 Spruce Orchard Dr
- 1747 Russet Valley Dr Unit 63
- 1722 Robin Knoll Ct
- 11612 Misty Moss Ct
- 12167 Plainsman Dr
- 1407 Summerhaven Dr
- 1425 Craig Rd
- 11538 Sandy View Dr Unit 212
- 12045 Bridal Shire Ct
- 11515 Sandy View Dr
- 11539 Sandy View Dr
- 1838 Moonstone Dr Unit 294
- 8 Montauk Ct
- 14 Montauk Dr
- 11469 Patty Ann Dr
- 11882 Shallowbrook Dr
- 11906 Shallowbrook Dr
- 11914 Shallowbrook Dr
- 11876 Shallowbrook Dr
- 11893 Shallowbrook Dr
- 11901 Shallowbrook Dr
- 11885 Shallowbrook Dr
- 11909 Shallowbrook Dr
- 11868 Shallowbrook Dr
- 11917 Shallowbrook Dr
- 11922 Shallowbrook Dr
- 11867 Shallowbrook Dr
- 11864 Featherwood Dr
- 11870 Featherwood Dr
- 11856 Featherwood Dr
- 11850 Featherwood Dr
- 11878 Featherwood Dr
- 11860 Shallowbrook Dr
- 11923 Shallowbrook Dr
- 11839 Gold Leaf Dr