Estimated Value: $366,000 - $413,181
3
Beds
3
Baths
1,809
Sq Ft
$218/Sq Ft
Est. Value
About This Home
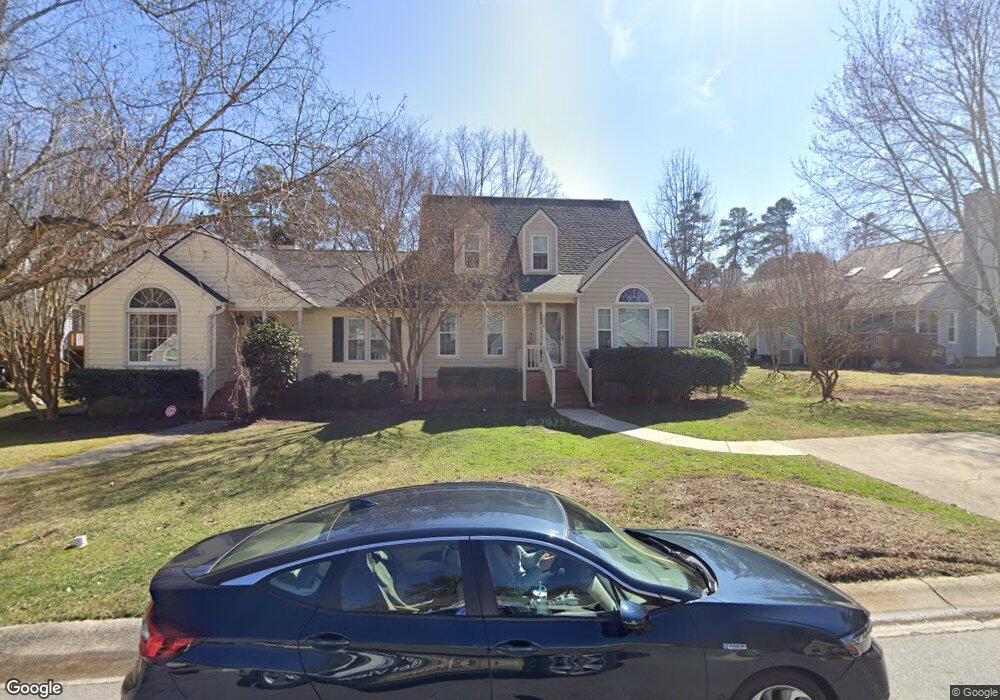
This home is located at 119 Altair Cir, Apex, NC 27502 and is currently estimated at $394,545, approximately $218 per square foot. 119 Altair Cir is a home located in Wake County with nearby schools including Apex Elementary School, Apex Middle, and Apex High School.
Ownership History
Date
Name
Owned For
Owner Type
Purchase Details
Closed on
Oct 30, 2015
Sold by
Hatrick Lynn A and Hatrick Lieslotte
Bought by
Durham William P and Durham Pamela C
Current Estimated Value
Purchase Details
Closed on
Mar 11, 2015
Sold by
Tingley Carol A and Hunter Janet T
Bought by
Hatrick Lynn A and Hatrick Lieselotte
Purchase Details
Closed on
Aug 9, 2004
Sold by
Kaplan Janice G
Bought by
Tingley Carol A and Hunter Paul
Home Financials for this Owner
Home Financials are based on the most recent Mortgage that was taken out on this home.
Original Mortgage
$116,800
Interest Rate
4.25%
Mortgage Type
Unknown
Purchase Details
Closed on
Feb 29, 2000
Sold by
Mitchell Linda F and Patterson Jerry E
Bought by
Kaplan Janice G
Home Financials for this Owner
Home Financials are based on the most recent Mortgage that was taken out on this home.
Original Mortgage
$90,000
Interest Rate
6.75%
Create a Home Valuation Report for This Property
The Home Valuation Report is an in-depth analysis detailing your home's value as well as a comparison with similar homes in the area
Home Values in the Area
Average Home Value in this Area
Purchase History
| Date | Buyer | Sale Price | Title Company |
|---|---|---|---|
| Durham William P | $195,000 | Attorney | |
| Hatrick Lynn A | $175,000 | None Available | |
| Tingley Carol A | $146,000 | -- | |
| Kaplan Janice G | $142,500 | -- |
Source: Public Records
Mortgage History
| Date | Status | Borrower | Loan Amount |
|---|---|---|---|
| Previous Owner | Tingley Carol A | $116,800 | |
| Previous Owner | Kaplan Janice G | $90,000 |
Source: Public Records
Tax History Compared to Growth
Tax History
| Year | Tax Paid | Tax Assessment Tax Assessment Total Assessment is a certain percentage of the fair market value that is determined by local assessors to be the total taxable value of land and additions on the property. | Land | Improvement |
|---|---|---|---|---|
| 2025 | $3,430 | $390,550 | $140,000 | $250,550 |
| 2024 | $3,353 | $390,550 | $140,000 | $250,550 |
| 2023 | $2,862 | $259,068 | $75,000 | $184,068 |
| 2022 | $2,687 | $259,068 | $75,000 | $184,068 |
| 2021 | $2,585 | $259,068 | $75,000 | $184,068 |
| 2020 | $2,559 | $259,068 | $75,000 | $184,068 |
| 2019 | $2,139 | $186,595 | $47,000 | $139,595 |
| 2018 | $2,015 | $186,595 | $47,000 | $139,595 |
| 2017 | $1,877 | $186,595 | $47,000 | $139,595 |
| 2016 | $1,850 | $186,595 | $47,000 | $139,595 |
| 2015 | $1,937 | $190,839 | $51,000 | $139,839 |
| 2014 | $1,867 | $190,839 | $51,000 | $139,839 |
Source: Public Records
Map
Nearby Homes
- 4006 New Yarmouth Way
- 1002 Eastham Dr
- 1106 Wellstone Cir
- 1000 Oakgate Ct
- 903 Norwood Ln
- 635 Sawcut Ln
- 631 Sawcut Ln
- 633 Sawcut Ln
- 596 Grand Central Station
- 295 Williams Grove Ln Unit Lot 67
- 214 Williams Grove Ln Unit Lot 4
- 285 Williams Grove Ln Unit Lot 65
- 218 Williams Grove Ln
- 226 Williams Grove Ln
- 262 Williams Grove Ln Unit Lot 76
- 268 Williams Grove Ln Unit Lot 75
- 278 Williams Grove Ln Unit Lot 73
- 286 Williams Grove Ln Unit Lot 71
- 294 Williams Grove Ln Unit 69
- 294 Williams Grove Ln
- 117 Altair Cir
- 133 Altair Cir
- 135 Altair Cir
- 107 Altair Cir
- 105 Altair Cir
- 103 Altair Cir
- 101 Altair Cir
- 118 Altair Cir
- 116 Altair Cir
- 120 Altair Cir
- 114 Altair Cir
- 122 Altair Cir
- 124 Altair Cir
- 112 Altair Cir
- 126 Altair Cir
- 129 Heatherwood Dr
- 131 Heatherwood Dr
- 128 Altair Cir
- 133 Heatherwood Dr
- 130 Altair Cir