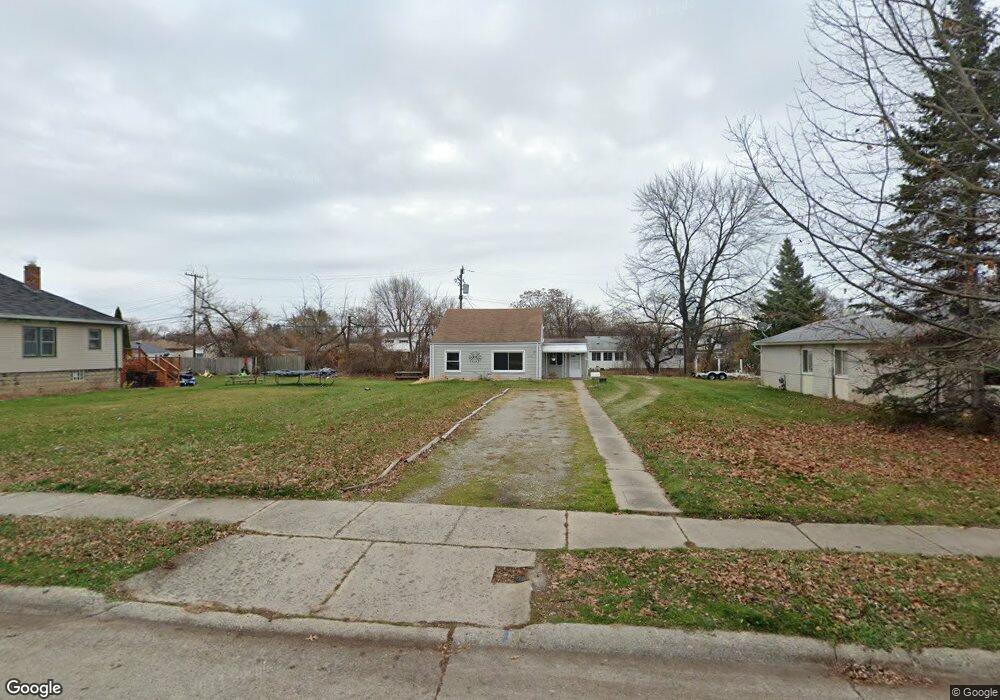
119 Beyne St Unit Bldg-Unit Mount Clemens, MI 48043
Estimated Value: $113,000 - $163,000
--
Bed
1
Bath
1,087
Sq Ft
$125/Sq Ft
Est. Value
About This Home
This home is located at 119 Beyne St Unit Bldg-Unit, Mount Clemens, MI 48043 and is currently estimated at $135,405, approximately $124 per square foot. 119 Beyne St Unit Bldg-Unit is a home located in Macomb County with nearby schools including Mount Clemens High School, Mt. Clemens Montessori Academy, and Montessori Stepping Stones School.
Ownership History
Date
Name
Owned For
Owner Type
Purchase Details
Closed on
Jun 15, 2021
Sold by
Diri Mohanned
Bought by
Gauthier Erin
Current Estimated Value
Purchase Details
Closed on
Mar 22, 2018
Sold by
Kanazawa Toshio and Caldwell Tyraa
Bought by
Diri Mohanned
Purchase Details
Closed on
Sep 9, 2014
Sold by
Suzuki Manabu and Koo Susan
Bought by
Kanazawa Toshio
Purchase Details
Closed on
Jul 16, 2012
Sold by
Reinus Investment Group Llc
Bought by
Suzuki Manabu
Purchase Details
Closed on
Apr 19, 2012
Sold by
Wells Fargo Bank Na
Bought by
Reinus Investment Group Llc
Purchase Details
Closed on
May 23, 2011
Sold by
Brownlee Shawn L
Bought by
Wells Fargo Bank Na
Purchase Details
Closed on
Jun 19, 2006
Sold by
Bell Theresa and Bell Theresa M
Bought by
Brownlee Shawn Lamont
Purchase Details
Closed on
Mar 27, 2003
Sold by
Hoak Robert and Hoak Donna
Bought by
Bell Theresa
Create a Home Valuation Report for This Property
The Home Valuation Report is an in-depth analysis detailing your home's value as well as a comparison with similar homes in the area
Home Values in the Area
Average Home Value in this Area
Purchase History
| Date | Buyer | Sale Price | Title Company |
|---|---|---|---|
| Gauthier Erin | $85,000 | Reputation First Ttl Agcy Ll | |
| Diri Mohanned | $10,000 | Cislo Title Co | |
| Kanazawa Toshio | $30,000 | None Available | |
| Suzuki Manabu | $23,000 | None Available | |
| Reinus Investment Group Llc | $9,500 | None Available | |
| Wells Fargo Bank Na | $6,000 | None Available | |
| Brownlee Shawn Lamont | $74,000 | Metropolitan Title Company | |
| Bell Theresa | $68,000 | Metropolitan Title Co |
Source: Public Records
Tax History Compared to Growth
Tax History
| Year | Tax Paid | Tax Assessment Tax Assessment Total Assessment is a certain percentage of the fair market value that is determined by local assessors to be the total taxable value of land and additions on the property. | Land | Improvement |
|---|---|---|---|---|
| 2025 | $2,764 | $58,300 | $0 | $0 |
| 2024 | $2,692 | $54,600 | $0 | $0 |
| 2023 | $2,579 | $49,000 | $0 | $0 |
| 2022 | $2,493 | $42,800 | $0 | $0 |
| 2021 | $2,419 | $39,500 | $0 | $0 |
| 2020 | $2,322 | $34,600 | $0 | $0 |
| 2019 | $2,400 | $30,000 | $0 | $0 |
| 2018 | $2,070 | $27,000 | $0 | $0 |
| 2017 | $2,595 | $25,593 | $5,682 | $19,911 |
| 2016 | $1,877 | $25,593 | $0 | $0 |
| 2015 | $1,664 | $24,095 | $0 | $0 |
| 2013 | -- | $22,539 | $5,411 | $17,128 |
Source: Public Records
Map
Nearby Homes
- 111 Kibbee St
- 43 Northbound Gratiot Ave
- 43 Southbound Gratiot Ave
- 55 Meadle St
- 30 Mulligan Dr
- 11 Southbound Gratiot Ave
- 129 South Ave
- 110 Smith St
- 5 River Bluff Dr Unit 104B
- 104 Riverside Dr
- 9 Queen St
- 98 Northbound Gratiot Ave Unit 33
- 190 Riverside Dr
- Gratiot Gratiot Ave
- 377 Wellington Crescent
- 38481 Riverside Dr
- 88 Crocker Blvd
- 334 Harrington St
- 38615 Meadowdale St
- 392 Cambridge Dr