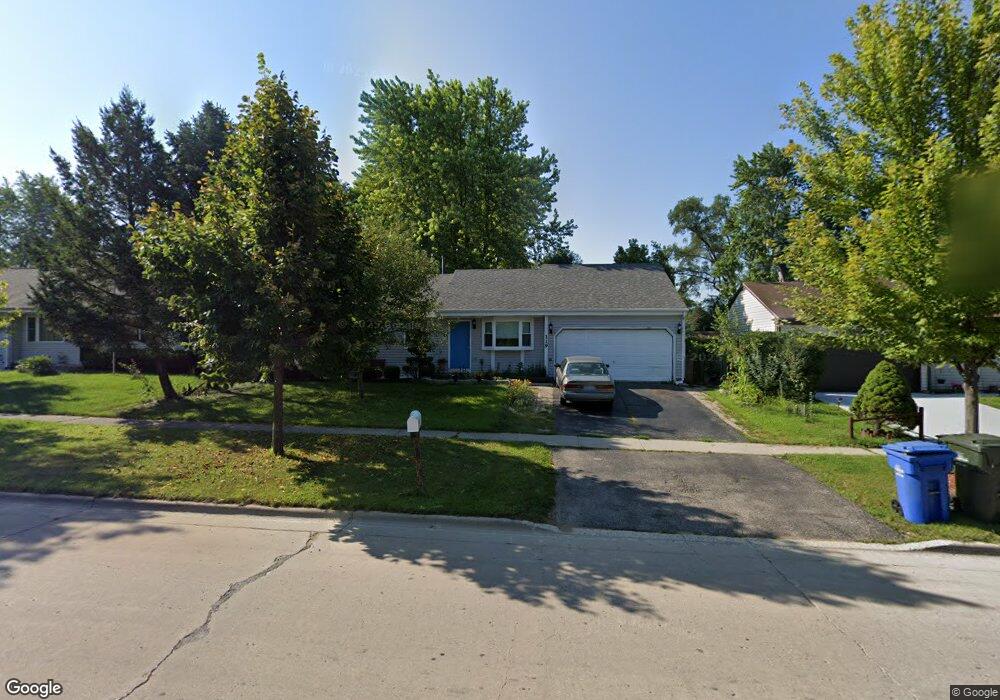
119 Bolz Rd Carpentersville, IL 60110
Estimated Value: $263,364 - $319,000
3
Beds
--
Bath
1,288
Sq Ft
$221/Sq Ft
Est. Value
About This Home
This home is located at 119 Bolz Rd, Carpentersville, IL 60110 and is currently estimated at $284,591, approximately $220 per square foot. 119 Bolz Rd is a home located in Kane County with nearby schools including Perry Elementary School, Crescent City Grade School, and Carpentersville Middle School.
Ownership History
Date
Name
Owned For
Owner Type
Purchase Details
Closed on
Oct 19, 2006
Sold by
Venegas Roberto
Bought by
Venegas Roberto and Venegas Lirio
Current Estimated Value
Home Financials for this Owner
Home Financials are based on the most recent Mortgage that was taken out on this home.
Original Mortgage
$137,000
Interest Rate
6.36%
Mortgage Type
New Conventional
Purchase Details
Closed on
Nov 8, 2002
Sold by
Mendoza Julian
Bought by
Venegas Roberto
Home Financials for this Owner
Home Financials are based on the most recent Mortgage that was taken out on this home.
Original Mortgage
$139,500
Interest Rate
6.23%
Purchase Details
Closed on
Aug 16, 2002
Sold by
Manufacturers & Traders Trust Company
Bought by
Mendoza Julian
Purchase Details
Closed on
Jun 28, 2002
Sold by
Kowalski Gloria M
Bought by
Manufactures & Traders Tr Co One M & T P
Create a Home Valuation Report for This Property
The Home Valuation Report is an in-depth analysis detailing your home's value as well as a comparison with similar homes in the area
Home Values in the Area
Average Home Value in this Area
Purchase History
| Date | Buyer | Sale Price | Title Company |
|---|---|---|---|
| Venegas Roberto | -- | Attorneys Title Guaranty Fun | |
| Venegas Roberto | $155,000 | Chicago Title Insurance Co | |
| Mendoza Julian | $120,000 | First American Title Co | |
| Manufactures & Traders Tr Co One M & T P | -- | Wheatland Title |
Source: Public Records
Mortgage History
| Date | Status | Borrower | Loan Amount |
|---|---|---|---|
| Closed | Venegas Roberto | $137,000 | |
| Previous Owner | Venegas Roberto | $139,500 |
Source: Public Records
Tax History Compared to Growth
Tax History
| Year | Tax Paid | Tax Assessment Tax Assessment Total Assessment is a certain percentage of the fair market value that is determined by local assessors to be the total taxable value of land and additions on the property. | Land | Improvement |
|---|---|---|---|---|
| 2024 | $5,041 | $74,567 | $12,553 | $62,014 |
| 2023 | $4,965 | $67,093 | $11,295 | $55,798 |
| 2022 | $5,230 | $66,061 | $11,295 | $54,766 |
| 2021 | $5,107 | $62,375 | $10,665 | $51,710 |
| 2020 | $5,022 | $60,972 | $10,425 | $50,547 |
| 2019 | $4,909 | $57,882 | $9,897 | $47,985 |
| 2018 | $4,976 | $56,140 | $9,701 | $46,439 |
| 2017 | $4,771 | $52,517 | $9,075 | $43,442 |
| 2016 | $4,369 | $45,711 | $8,787 | $36,924 |
| 2015 | -- | $34,921 | $8,234 | $26,687 |
| 2014 | -- | $31,177 | $8,007 | $23,170 |
| 2013 | -- | $32,131 | $8,252 | $23,879 |
Source: Public Records
Map
Nearby Homes
- 2013 Silverstone Dr Unit 2013
- 1431 Silverstone Dr Unit 1416
- 200 Amarillo Dr
- 1811 IL Rte 25 (Elgin) Rd
- 308 Amarillo Ct
- 2245 Flagstone Ln Unit 155
- 105 Siesta Rd
- 713 Silverstone Dr Unit 77
- 1309 Silverstone Dr Unit 1305
- 1303 Silverstone Dr Unit 1302
- 1426 Kings Rd
- 140 Hickory Dr
- 1551 Glacier Trail Unit 644
- 7 Autumn Trail
- 103 Hickory Dr
- 336 Delaware St
- 171 Lake Shore Dr
- 451 Mahogany Dr
- 944 Cortney Dr
- 431 Mahogany Dr