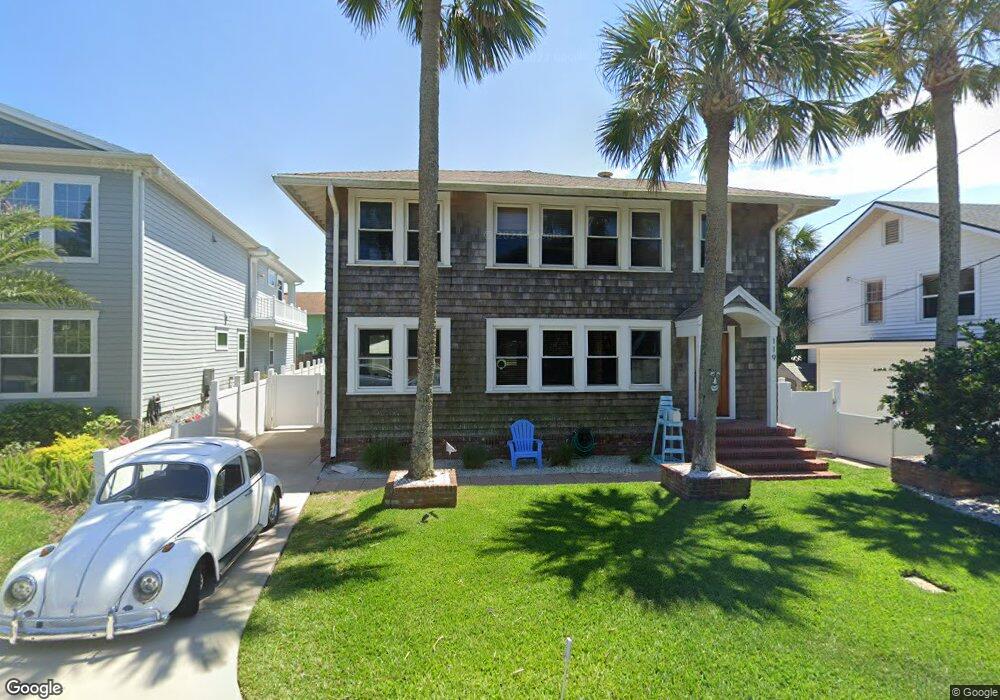
119 Bowles St Neptune Beach, FL 32266
Estimated Value: $1,114,000 - $2,002,000
5
Beds
3
Baths
3,050
Sq Ft
$496/Sq Ft
Est. Value
About This Home
This home is located at 119 Bowles St, Neptune Beach, FL 32266 and is currently estimated at $1,511,802, approximately $495 per square foot. 119 Bowles St is a home located in Duval County with nearby schools including Neptune Beach Elementary School, Duncan U. Fletcher Middle School, and Duncan U. Fletcher High School.
Ownership History
Date
Name
Owned For
Owner Type
Purchase Details
Closed on
Nov 13, 2001
Sold by
Laird Kay L and Laughlin Kay L
Bought by
Laughlin David C and Laughlin Ashley B
Current Estimated Value
Home Financials for this Owner
Home Financials are based on the most recent Mortgage that was taken out on this home.
Original Mortgage
$208,000
Interest Rate
7%
Create a Home Valuation Report for This Property
The Home Valuation Report is an in-depth analysis detailing your home's value as well as a comparison with similar homes in the area
Home Values in the Area
Average Home Value in this Area
Purchase History
| Date | Buyer | Sale Price | Title Company |
|---|---|---|---|
| Laughlin David C | $200,000 | -- |
Source: Public Records
Mortgage History
| Date | Status | Borrower | Loan Amount |
|---|---|---|---|
| Closed | Laughlin David C | $208,000 |
Source: Public Records
Tax History
| Year | Tax Paid | Tax Assessment Tax Assessment Total Assessment is a certain percentage of the fair market value that is determined by local assessors to be the total taxable value of land and additions on the property. | Land | Improvement |
|---|---|---|---|---|
| 2026 | $7,258 | $448,592 | -- | -- |
| 2025 | $7,115 | $448,976 | -- | -- |
| 2024 | $6,946 | $437,780 | -- | -- |
| 2023 | $6,946 | $430,232 | $0 | $0 |
| 2022 | $6,287 | $410,053 | $0 | $0 |
| 2021 | $6,210 | $395,074 | $0 | $0 |
| 2020 | $6,140 | $388,914 | $0 | $0 |
| 2019 | $6,091 | $380,937 | $0 | $0 |
| 2018 | $5,997 | $372,687 | $0 | $0 |
| 2017 | $6,070 | $372,702 | $0 | $0 |
| 2016 | $6,032 | $365,995 | $0 | $0 |
| 2015 | $6,044 | $361,154 | $0 | $0 |
| 2014 | $5,995 | $354,052 | $0 | $0 |
Source: Public Records
Map
Nearby Homes
- 1403 Ocean Front
- 1408 Strand St
- 230 Davis St
- 1914 1st St
- 1102 Ocean Front
- 123 Margaret St
- 229 Margaret St
- 206 Hopkins St
- 404 Margaret St
- 300 Bay St
- 527 Florida Blvd
- 11 19th Ave N
- 215 19th Ave N Unit B
- 123 18th Ave N
- 1901 1st St N Unit 1002
- 1901 1st St N Unit 203
- 1901 1st St N Unit 902
- 552 Seagate Ave
- 1701 1st St N Unit 2B
- 111 Cherry St
Your Personal Tour Guide
Ask me questions while you tour the home.