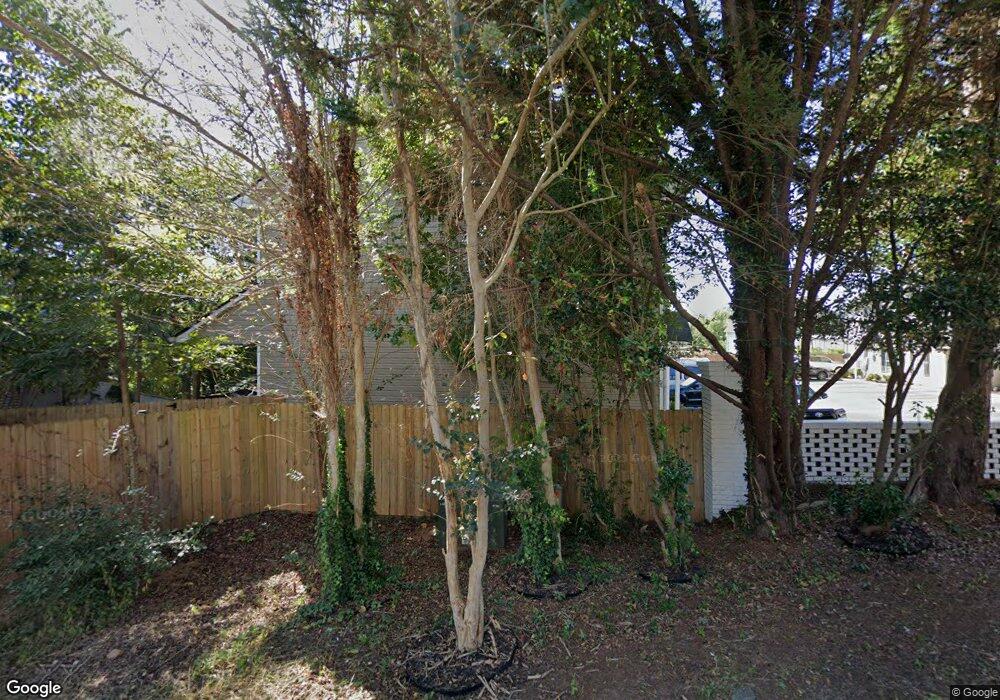
119 Boyd Cir Unit J Dahlonega, GA 30533
Estimated Value: $318,000 - $490,000
--
Bed
4
Baths
2,262
Sq Ft
$169/Sq Ft
Est. Value
About This Home
This home is located at 119 Boyd Cir Unit J, Dahlonega, GA 30533 and is currently estimated at $381,939, approximately $168 per square foot. 119 Boyd Cir Unit J is a home located in Lumpkin County with nearby schools including Clay County Middle School and Lumpkin County High School.
Ownership History
Date
Name
Owned For
Owner Type
Purchase Details
Closed on
Jun 1, 2022
Sold by
119 Boyd J Llc
Bought by
Smith Leslie B and Smith Vicki
Current Estimated Value
Home Financials for this Owner
Home Financials are based on the most recent Mortgage that was taken out on this home.
Original Mortgage
$202,400
Outstanding Balance
$188,549
Interest Rate
5.27%
Mortgage Type
New Conventional
Estimated Equity
$193,390
Purchase Details
Closed on
Nov 21, 2018
Sold by
Rivera Oscar
Bought by
119 Boyd J Llc
Purchase Details
Closed on
Jun 25, 2013
Sold by
Hansen Daniel D
Bought by
Rivera Oscar R and Rivera Darlene
Purchase Details
Closed on
Apr 1, 2004
Sold by
Adams Al C
Bought by
Hansen Daniel D and Hansen Beverly D
Purchase Details
Closed on
May 22, 2002
Sold by
Grindle Danny
Bought by
Adams Al C
Purchase Details
Closed on
Oct 8, 1998
Bought by
Grindle Danny
Create a Home Valuation Report for This Property
The Home Valuation Report is an in-depth analysis detailing your home's value as well as a comparison with similar homes in the area
Home Values in the Area
Average Home Value in this Area
Purchase History
| Date | Buyer | Sale Price | Title Company |
|---|---|---|---|
| Smith Leslie B | $270,000 | -- | |
| 119 Boyd J Llc | -- | -- | |
| Rivera Oscar R | $130,000 | -- | |
| Hansen Daniel D | $140,000 | -- | |
| Adams Al C | $137,500 | -- | |
| Grindle Danny | $80,000 | -- |
Source: Public Records
Mortgage History
| Date | Status | Borrower | Loan Amount |
|---|---|---|---|
| Open | Smith Leslie B | $202,400 |
Source: Public Records
Tax History Compared to Growth
Tax History
| Year | Tax Paid | Tax Assessment Tax Assessment Total Assessment is a certain percentage of the fair market value that is determined by local assessors to be the total taxable value of land and additions on the property. | Land | Improvement |
|---|---|---|---|---|
| 2024 | $227 | $103,674 | $10,000 | $93,674 |
| 2023 | $2,809 | $97,450 | $10,000 | $87,450 |
| 2022 | $2,449 | $80,169 | $10,000 | $70,169 |
| 2021 | $2,230 | $68,354 | $10,000 | $58,354 |
| 2020 | $2,263 | $66,775 | $10,000 | $56,775 |
| 2019 | $2,274 | $66,775 | $10,000 | $56,775 |
| 2018 | $2,173 | $59,709 | $10,000 | $49,709 |
| 2017 | $2,129 | $57,528 | $10,000 | $47,528 |
| 2016 | $2,025 | $53,518 | $10,000 | $43,518 |
| 2015 | $1,683 | $53,518 | $10,000 | $43,518 |
| 2014 | $1,683 | $54,036 | $10,000 | $44,036 |
| 2013 | -- | $55,072 | $10,000 | $45,072 |
Source: Public Records
Map
Nearby Homes
- 119 Boyd Cir Unit D
- 95 Jones St
- 0 S Chestatee St Unit 10619536
- 315 Church St
- 399 N Chestatee St
- 1392 S Chestatee St
- 329 Morrison Moore Pkwy E
- 168 W Main St
- 6480A Highway 52
- 120 Riley Rd
- 502 Wimpy Mill Rd
- 10 Rustin Ridge
- 0 Highway 60 Unit 7241582
- 0 Highway 9 S Unit 10487179
- 0 Highway 9 S Unit 7548614
- 94 Mountain View Dr
- 0 Calhoun Rd Unit 7643314
- 0 Calhoun Rd Unit 10598012
- 00 Calhoun Rd
- 0 Alicia Ln
- 119A Boyd Cir
- 119 Boyd Cir
- 119 Boyd Cir Unit D
- 119 Boyd Cir Unit I
- 119 Boyd Cir Unit H
- 119 Boyd Cir Unit G
- 119 Boyd Cir Unit F
- 119 Boyd Cir Unit E
- 119 Boyd Cir Unit C
- 119 Boyd Cir Unit B
- 119 Boyd Cir Unit A
- 119A Boyd Cir Unit A
- 119 Boyd Cir
- 119 Boyd Rd
- 61 Boyd Cir
- 61 Boyd Cir Unit A
- 51 Boyd Cir
- 119B Boyd Cir
- 119B Boyd Cir Unit 119B
- 33 Boyd Cir