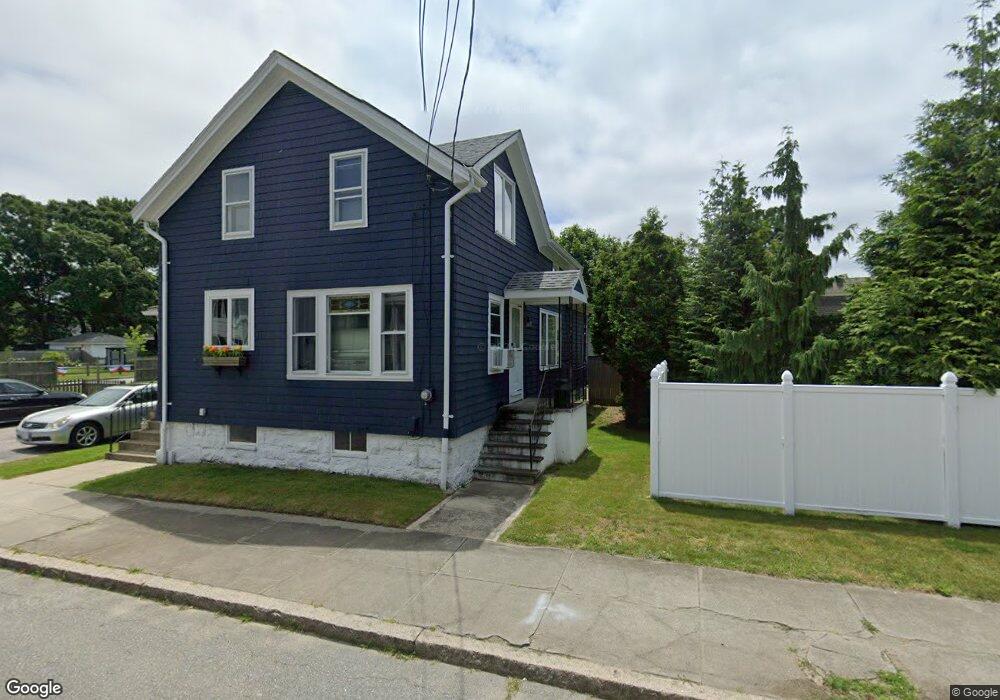
119 Bullock St Fall River, MA 02723
Bank Street NeighborhoodEstimated Value: $442,116 - $533,000
4
Beds
1
Bath
1,343
Sq Ft
$349/Sq Ft
Est. Value
About This Home
This home is located at 119 Bullock St, Fall River, MA 02723 and is currently estimated at $469,279, approximately $349 per square foot. 119 Bullock St is a home located in Bristol County with nearby schools including Mary Fonseca Elementary School, Talbot Innovation School, and B M C Durfee High School.
Ownership History
Date
Name
Owned For
Owner Type
Purchase Details
Closed on
Sep 30, 2015
Sold by
Charbonneau Thomas A and Charbonneau George T
Bought by
Charbonneau Blake A
Current Estimated Value
Home Financials for this Owner
Home Financials are based on the most recent Mortgage that was taken out on this home.
Original Mortgage
$135,000
Outstanding Balance
$105,302
Interest Rate
3.95%
Mortgage Type
New Conventional
Estimated Equity
$363,977
Create a Home Valuation Report for This Property
The Home Valuation Report is an in-depth analysis detailing your home's value as well as a comparison with similar homes in the area
Home Values in the Area
Average Home Value in this Area
Purchase History
| Date | Buyer | Sale Price | Title Company |
|---|---|---|---|
| Charbonneau Blake A | $150,000 | -- | |
| Charbonneau Blake A | $150,000 | -- |
Source: Public Records
Mortgage History
| Date | Status | Borrower | Loan Amount |
|---|---|---|---|
| Open | Charbonneau Blake A | $135,000 | |
| Closed | Charbonneau Blake A | $135,000 |
Source: Public Records
Tax History
| Year | Tax Paid | Tax Assessment Tax Assessment Total Assessment is a certain percentage of the fair market value that is determined by local assessors to be the total taxable value of land and additions on the property. | Land | Improvement |
|---|---|---|---|---|
| 2025 | $4,160 | $363,300 | $131,900 | $231,400 |
| 2024 | $3,911 | $340,400 | $126,900 | $213,500 |
| 2023 | $3,610 | $294,200 | $108,800 | $185,400 |
| 2022 | $3,319 | $263,000 | $98,900 | $164,100 |
| 2021 | $3,065 | $221,600 | $91,500 | $130,100 |
| 2020 | $2,656 | $183,800 | $87,600 | $96,200 |
| 2019 | $2,530 | $173,500 | $83,400 | $90,100 |
| 2018 | $2,383 | $163,000 | $81,900 | $81,100 |
| 2017 | $2,282 | $163,000 | $83,500 | $79,500 |
| 2016 | $2,212 | $162,300 | $87,000 | $75,300 |
| 2015 | $2,081 | $159,100 | $83,800 | $75,300 |
| 2014 | $2,057 | $163,500 | $88,200 | $75,300 |
Source: Public Records
Map
Nearby Homes
- 103 Bullock St
- 195 Hill St
- 166 Hill St
- 126 Bullock St
- 112 Bullock St
- 171 Ratcliffe St
- 171 Ratcliffe St Unit B
- 171 Ratcliffe St Unit 1
- 163 Bullock St
- 167 Hill St
- 179 Bullock St
- 159 Ratcliffe St
- 144 Hill St
- 168 Bullock St
- 147 David St
- 83 Bullock St
- 174 Ratcliffe St
- 162 Ratcliffe St
- 512 Sherman St
- 130 Hill St
Your Personal Tour Guide
Ask me questions while you tour the home.