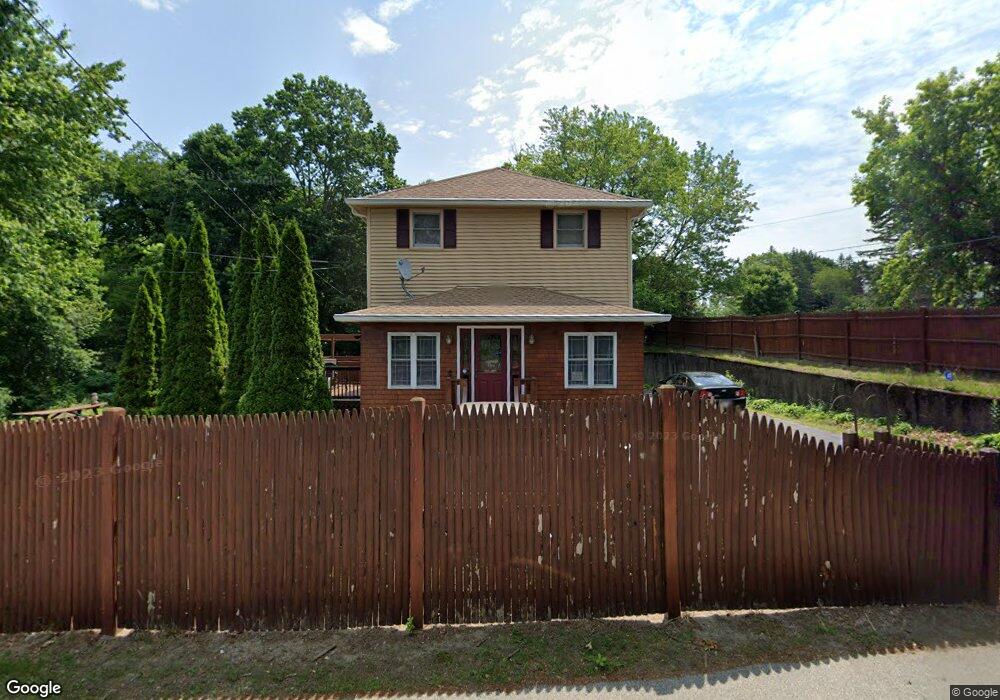
119 Burnett St Auburn, MA 01501
Stoneville NeighborhoodEstimated Value: $496,715 - $550,000
2
Beds
3
Baths
1,788
Sq Ft
$296/Sq Ft
Est. Value
About This Home
This home is located at 119 Burnett St, Auburn, MA 01501 and is currently estimated at $528,929, approximately $295 per square foot. 119 Burnett St is a home located in Worcester County with nearby schools including Auburn Senior High School and Shrewsbury Montessori School - Auburn Campus.
Ownership History
Date
Name
Owned For
Owner Type
Purchase Details
Closed on
Aug 31, 1990
Sold by
Mccarthy Robert J
Bought by
Coyle Patrick A
Current Estimated Value
Home Financials for this Owner
Home Financials are based on the most recent Mortgage that was taken out on this home.
Original Mortgage
$129,000
Interest Rate
9.85%
Mortgage Type
Purchase Money Mortgage
Create a Home Valuation Report for This Property
The Home Valuation Report is an in-depth analysis detailing your home's value as well as a comparison with similar homes in the area
Home Values in the Area
Average Home Value in this Area
Purchase History
| Date | Buyer | Sale Price | Title Company |
|---|---|---|---|
| Coyle Patrick A | $137,000 | -- |
Source: Public Records
Mortgage History
| Date | Status | Borrower | Loan Amount |
|---|---|---|---|
| Open | Coyle Patrick A | $43,000 | |
| Closed | Coyle Patrick A | $125,000 | |
| Closed | Coyle Patrick A | $129,000 | |
| Previous Owner | Coyle Patrick A | $20,000 |
Source: Public Records
Tax History Compared to Growth
Tax History
| Year | Tax Paid | Tax Assessment Tax Assessment Total Assessment is a certain percentage of the fair market value that is determined by local assessors to be the total taxable value of land and additions on the property. | Land | Improvement |
|---|---|---|---|---|
| 2025 | $61 | $428,400 | $117,400 | $311,000 |
| 2024 | $6,117 | $409,700 | $113,000 | $296,700 |
| 2023 | $6,085 | $383,200 | $102,800 | $280,400 |
| 2022 | $5,692 | $338,400 | $102,800 | $235,600 |
| 2021 | $5,435 | $299,600 | $90,800 | $208,800 |
| 2020 | $5,171 | $287,600 | $90,800 | $196,800 |
| 2019 | $4,861 | $263,900 | $90,000 | $173,900 |
| 2018 | $6,038 | $254,500 | $84,200 | $170,300 |
| 2017 | $4,523 | $246,600 | $76,300 | $170,300 |
| 2016 | $4,012 | $221,800 | $78,700 | $143,100 |
| 2015 | $3,721 | $215,600 | $78,700 | $136,900 |
| 2014 | $3,624 | $209,600 | $74,900 | $134,700 |
Source: Public Records
Map
Nearby Homes
- 177 Oxford St N
- 1-9 Helens Way
- 19-20 Williams St
- 177 Boyce St
- 176 Boyce St
- 25 Vinal St Unit 26
- 25 Vinal St Unit 29
- 25 Vinal St Unit 30
- 27 Havana Rd
- 5 Commonwealth Ave
- 2 Keen St
- 34 Rockland Rd
- 315 Stafford St
- 8 Shirley St
- 11 Inwood Rd
- 4 S Edlin St
- 53 James St
- 3 Old Cart Rd
- 33 Walsh Ave
- 31-33 Walsh Ave