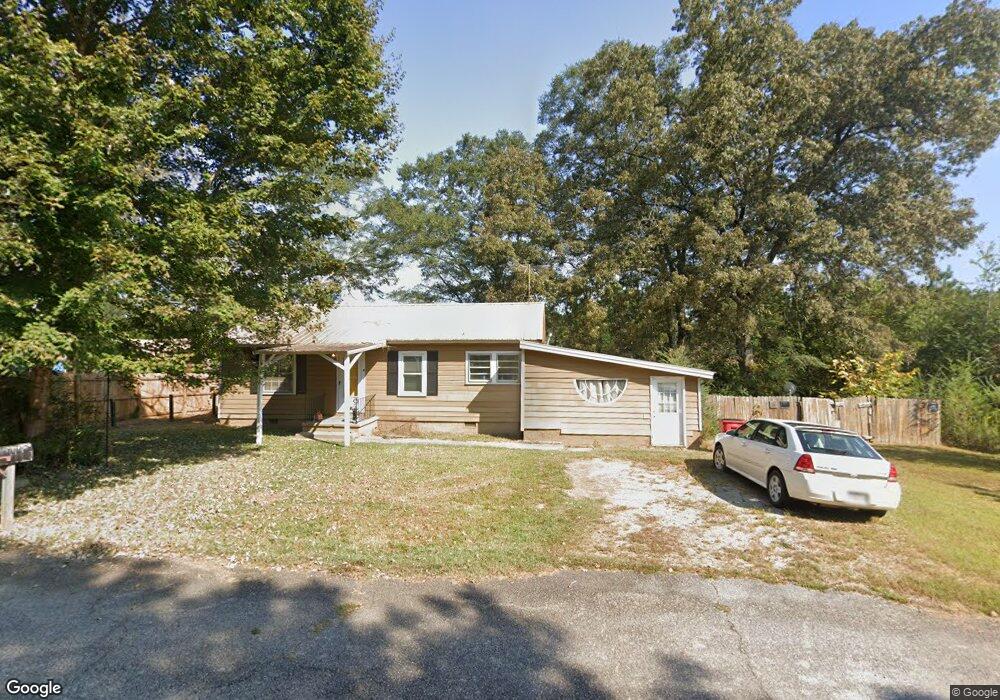
119 Campbell Ave Bowdon, GA 30108
Estimated Value: $137,000 - $163,547
2
Beds
1
Bath
1,184
Sq Ft
$130/Sq Ft
Est. Value
About This Home
This home is located at 119 Campbell Ave, Bowdon, GA 30108 and is currently estimated at $153,387, approximately $129 per square foot. 119 Campbell Ave is a home located in Carroll County with nearby schools including Bowdon Elementary School, Bowdon Middle School, and Bowdon High School.
Ownership History
Date
Name
Owned For
Owner Type
Purchase Details
Closed on
Oct 11, 2024
Sold by
Marks Jimmy B
Bought by
Reed Richy
Current Estimated Value
Home Financials for this Owner
Home Financials are based on the most recent Mortgage that was taken out on this home.
Original Mortgage
$5,250
Outstanding Balance
$5,195
Interest Rate
6.35%
Mortgage Type
New Conventional
Estimated Equity
$148,192
Purchase Details
Closed on
Dec 20, 2019
Sold by
Secretary Of Housing And Urban Developme
Bought by
Marks Jimmy B
Purchase Details
Closed on
Apr 2, 2019
Sold by
Wood Sharon
Bought by
Bankunited Na
Purchase Details
Closed on
May 10, 2005
Sold by
Betts Judy P
Bought by
Wood Sharon
Home Financials for this Owner
Home Financials are based on the most recent Mortgage that was taken out on this home.
Original Mortgage
$51,555
Interest Rate
5.8%
Mortgage Type
FHA
Purchase Details
Closed on
Sep 20, 1995
Bought by
Betts Judy P
Purchase Details
Closed on
Dec 23, 1976
Bought by
Lolley Mary R
Create a Home Valuation Report for This Property
The Home Valuation Report is an in-depth analysis detailing your home's value as well as a comparison with similar homes in the area
Home Values in the Area
Average Home Value in this Area
Purchase History
| Date | Buyer | Sale Price | Title Company |
|---|---|---|---|
| Reed Richy | $150,000 | -- | |
| Marks Jimmy B | $24,500 | -- | |
| Bankunited Na | $40,853 | -- | |
| Wood Sharon | $52,400 | -- | |
| Betts Judy P | $36,000 | -- | |
| Lolley Mary R | -- | -- |
Source: Public Records
Mortgage History
| Date | Status | Borrower | Loan Amount |
|---|---|---|---|
| Open | Reed Richy | $5,250 | |
| Open | Reed Richy | $147,283 | |
| Previous Owner | Wood Sharon | $51,555 |
Source: Public Records
Tax History Compared to Growth
Tax History
| Year | Tax Paid | Tax Assessment Tax Assessment Total Assessment is a certain percentage of the fair market value that is determined by local assessors to be the total taxable value of land and additions on the property. | Land | Improvement |
|---|---|---|---|---|
| 2024 | $1,324 | $45,515 | $5,917 | $39,598 |
| 2023 | $1,324 | $41,864 | $5,918 | $35,946 |
| 2022 | $1,064 | $32,852 | $3,942 | $28,910 |
| 2021 | $927 | $27,791 | $2,920 | $24,871 |
| 2020 | $329 | $25,205 | $2,920 | $22,285 |
| 2019 | $801 | $23,500 | $2,920 | $20,580 |
| 2018 | $739 | $21,224 | $2,920 | $18,304 |
| 2017 | $741 | $21,224 | $2,920 | $18,304 |
| 2016 | $741 | $21,224 | $2,920 | $18,304 |
| 2015 | $699 | $19,120 | $6,000 | $13,120 |
| 2014 | $703 | $19,120 | $6,000 | $13,120 |
Source: Public Records
Map
Nearby Homes
- 0 Magnolia St Unit 7657311
- 0 Magnolia St Unit 10614572
- 110 Bevis Cir
- 674 Wedowee St
- 0 Hwy 100 Unit LotWP001 24911780
- 0 Hwy 100 Unit 10541558
- 717 Wedowee St
- 101 Winding Road - Lot 1a & 1b & Lot 2
- 721 Wedowee St
- 310 Pine Cir
- 310 W College St
- 313 Ellenwood Dr
- 425 Mitchell Ave
- 460 Sally Ann Cir
- 400/460 Sally Ann Cir
- 407 E College St
- 427 E College St
- 0 College View St Unit 7641168
- 0 College View St Unit 10594648
- 6.41 ac N Carroll St & Ave W
- 0 Campbell Ave Unit 8613999
- 0 Campbell Ave Unit 8005401
- 0 Campbell Ave Unit 8565281
- 115 Campbell Ave
- 520 Campbell Ave
- 111 Campbell Ave
- 203 Campbell Ave
- 200 Campbell Ave
- 521 Tyus Rd
- 605 Tyus Rd
- 513 Campbell Ave
- 513 Wedowee St
- 517 Wedowee St
- 502 Campbell Ave
- 607 Wedowee St
- 416 Wedowee St
- 512 Campbell Ave
- 510 Wedowee St
- 104 Bevis Cir
- 414 Wedowee St