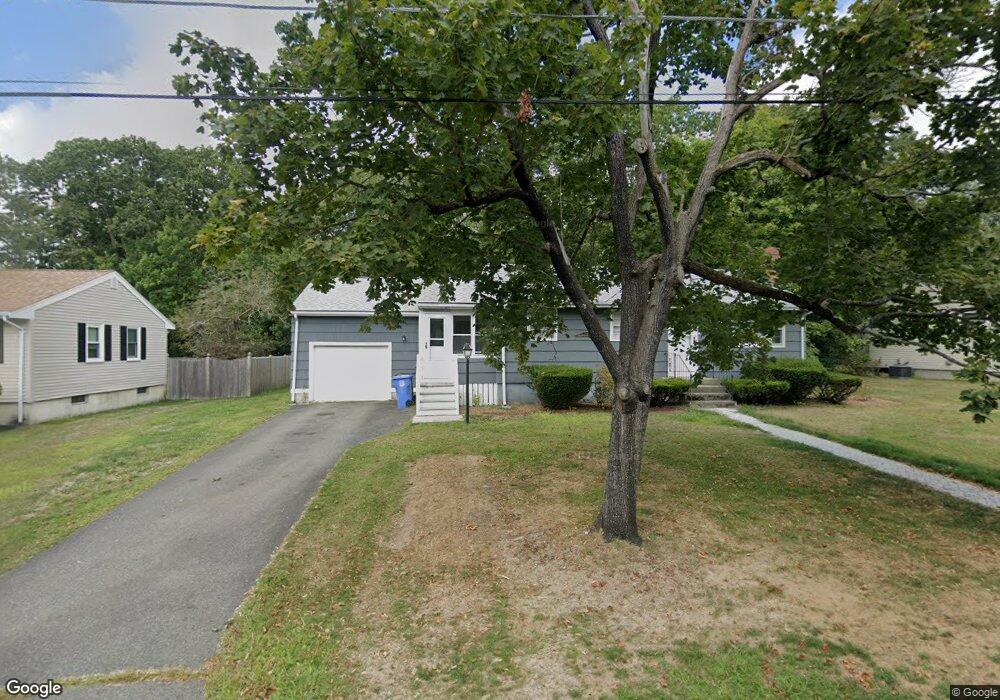
119 Carleton Street Extension Whitman, MA 02382
Estimated Value: $461,000 - $480,000
3
Beds
1
Bath
1,123
Sq Ft
$417/Sq Ft
Est. Value
About This Home
This home is located at 119 Carleton Street Extension, Whitman, MA 02382 and is currently estimated at $468,284, approximately $416 per square foot. 119 Carleton Street Extension is a home located in Plymouth County with nearby schools including St Bridget School.
Ownership History
Date
Name
Owned For
Owner Type
Purchase Details
Closed on
Mar 25, 2022
Sold by
Brady Joan M Est and Leppo
Bought by
Thureson Leif N
Current Estimated Value
Home Financials for this Owner
Home Financials are based on the most recent Mortgage that was taken out on this home.
Original Mortgage
$332,405
Outstanding Balance
$309,182
Interest Rate
3.69%
Mortgage Type
Purchase Money Mortgage
Estimated Equity
$159,102
Purchase Details
Closed on
Feb 19, 2004
Sold by
Brady Joan M
Bought by
Brady Joan M
Purchase Details
Closed on
Aug 5, 1996
Sold by
Whitman Int and Whitman Bloomstein
Bought by
Giannotti Alfred A
Home Financials for this Owner
Home Financials are based on the most recent Mortgage that was taken out on this home.
Original Mortgage
$132,900
Interest Rate
8.27%
Mortgage Type
Purchase Money Mortgage
Create a Home Valuation Report for This Property
The Home Valuation Report is an in-depth analysis detailing your home's value as well as a comparison with similar homes in the area
Home Values in the Area
Average Home Value in this Area
Purchase History
| Date | Buyer | Sale Price | Title Company |
|---|---|---|---|
| Thureson Leif N | $349,900 | None Available | |
| Brady Joan M | -- | -- | |
| Brady Joan M | -- | -- | |
| Giannotti Alfred A | $139,900 | -- | |
| Giannotti Alfred A | $139,900 | -- |
Source: Public Records
Mortgage History
| Date | Status | Borrower | Loan Amount |
|---|---|---|---|
| Open | Thureson Leif N | $332,405 | |
| Previous Owner | Giannotti Alfred A | $132,900 | |
| Previous Owner | Giannotti Alfred A | $50,000 |
Source: Public Records
Tax History Compared to Growth
Tax History
| Year | Tax Paid | Tax Assessment Tax Assessment Total Assessment is a certain percentage of the fair market value that is determined by local assessors to be the total taxable value of land and additions on the property. | Land | Improvement |
|---|---|---|---|---|
| 2025 | $5,353 | $408,000 | $208,700 | $199,300 |
| 2024 | $5,030 | $394,800 | $204,700 | $190,100 |
| 2023 | $4,825 | $355,600 | $177,500 | $178,100 |
| 2022 | $4,717 | $324,000 | $161,300 | $162,700 |
| 2021 | $4,597 | $296,600 | $148,200 | $148,400 |
| 2020 | $4,459 | $281,300 | $141,200 | $140,100 |
| 2019 | $4,180 | $271,800 | $141,200 | $130,600 |
| 2018 | $3,847 | $251,900 | $133,100 | $118,800 |
| 2017 | $3,799 | $251,900 | $133,100 | $118,800 |
| 2016 | $3,611 | $231,600 | $126,000 | $105,600 |
| 2015 | $3,380 | $216,500 | $110,900 | $105,600 |
Source: Public Records
Map
Nearby Homes
- 40 Lazel St
- 170 Pleasant St
- 608 Plymouth St
- 23 Reed Place
- 679 Plymouth St
- 110 South Ave Unit 14
- 63 Dewey Ave
- 684 South Ave
- 54-56 Stetson St
- 48 Day St
- 20 Elm Place
- 137 Peregrine Rd
- 532 Washington St
- 53 Temple St
- 35 Dana St
- 214 Winter St
- 135-137 Temple St
- 131 Holly Ridge Dr
- 164 Warren Ave
- 55 Plymouth St Unit A5
- 119 Carleton St
- 127 Carleton Street Extension
- 111 Carleton Street Extension
- 32 Benson St Unit 32
- 30 Benson Street Extension Unit 32
- 109 Carleton Street Extension
- 126 Carleton St
- 118 Carleton Street Extension
- 109 Carleton St
- 39 Suffolk St
- 126 Carleton Street Extension
- 110 Carleton Street Extension
- 242 Raynor Ave
- 53 Suffolk St
- 106 Carleton St
- 106 Carleton Street Extension
- 134 Carleton Street Extension
- 134 Carleton St
- 228 Raynor Ave
- 232 Raynor Ave