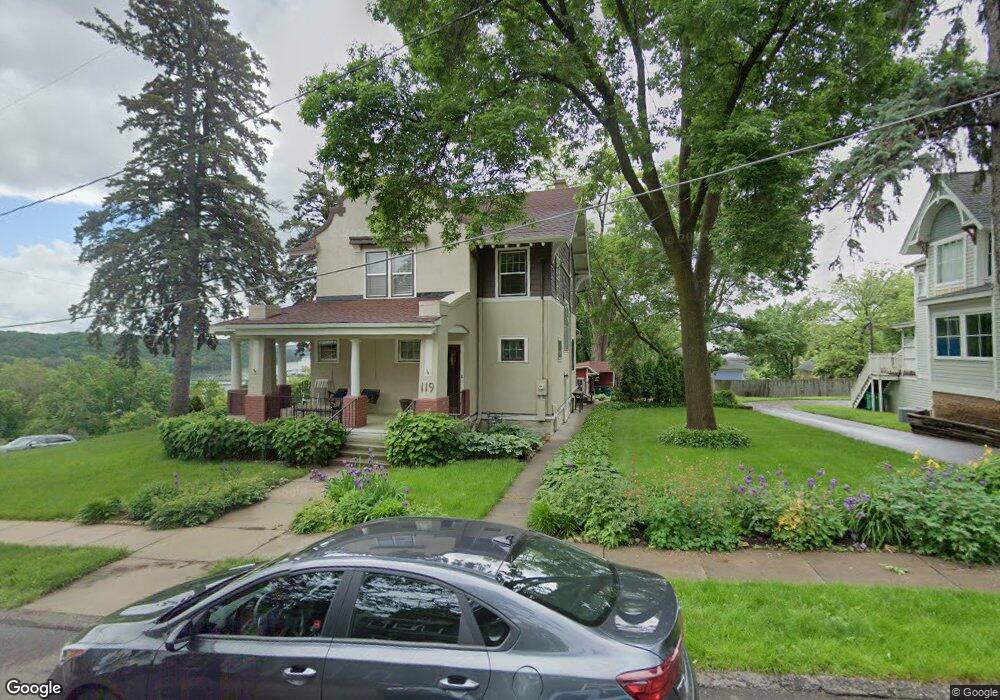
119 Cherry St E Stillwater, MN 55082
Estimated Value: $707,000 - $1,054,000
4
Beds
4
Baths
3,721
Sq Ft
$255/Sq Ft
Est. Value
About This Home
This home is located at 119 Cherry St E, Stillwater, MN 55082 and is currently estimated at $948,737, approximately $254 per square foot. 119 Cherry St E is a home located in Washington County with nearby schools including Lily Lake Elementary School, Stillwater Middle School, and Stillwater Area High School.
Ownership History
Date
Name
Owned For
Owner Type
Purchase Details
Closed on
Nov 4, 2020
Sold by
Brand Erik C and Brand Pamela J
Bought by
Bates Clifford
Current Estimated Value
Home Financials for this Owner
Home Financials are based on the most recent Mortgage that was taken out on this home.
Original Mortgage
$510,000
Interest Rate
2.7%
Mortgage Type
New Conventional
Create a Home Valuation Report for This Property
The Home Valuation Report is an in-depth analysis detailing your home's value as well as a comparison with similar homes in the area
Home Values in the Area
Average Home Value in this Area
Purchase History
| Date | Buyer | Sale Price | Title Company |
|---|---|---|---|
| Bates Clifford | $795,000 | Legacy Title | |
| Bates Clifford Clifford | $795,000 | -- |
Source: Public Records
Mortgage History
| Date | Status | Borrower | Loan Amount |
|---|---|---|---|
| Previous Owner | Bates Clifford | $510,000 | |
| Closed | Bates Clifford Clifford | $510,000 |
Source: Public Records
Tax History
| Year | Tax Paid | Tax Assessment Tax Assessment Total Assessment is a certain percentage of the fair market value that is determined by local assessors to be the total taxable value of land and additions on the property. | Land | Improvement |
|---|---|---|---|---|
| 2024 | $12,712 | $959,600 | $479,200 | $480,400 |
| 2023 | $12,348 | $957,300 | $514,200 | $443,100 |
| 2022 | $9,494 | $943,600 | $492,600 | $451,000 |
| 2021 | $6,204 | $744,200 | $390,000 | $354,200 |
| 2020 | $6,286 | $530,100 | $255,000 | $275,100 |
| 2019 | $6,014 | $530,100 | $255,000 | $275,100 |
| 2018 | $5,866 | $485,800 | $250,000 | $235,800 |
| 2017 | $5,476 | $473,200 | $240,000 | $233,200 |
| 2016 | $5,746 | $421,900 | $195,000 | $226,900 |
| 2015 | $5,448 | $424,200 | $195,000 | $229,200 |
| 2013 | -- | $371,400 | $169,400 | $202,000 |
Source: Public Records
Map
Nearby Homes
- 620 Main St N Unit 124
- 620 Main St N Unit 311
- 501 Main St N Unit 500
- 610 Main St N Unit 305
- 640 Main St N Unit 42
- 206 Elm St W
- 410 Linden St W
- 1013 Broadway St N
- 108 3rd St S Unit 3
- 107 3rd St N
- 612 Rice St W
- 301 3rd St S Unit 301
- 716 Owens St N
- 724 Olive St W
- 109 Pine St E
- 123 Pine St E
- 1016 Linden St W
- 418 Holcombe St S
- xxxx Ramsey St W
- 211 Olive St W
Your Personal Tour Guide
Ask me questions while you tour the home.